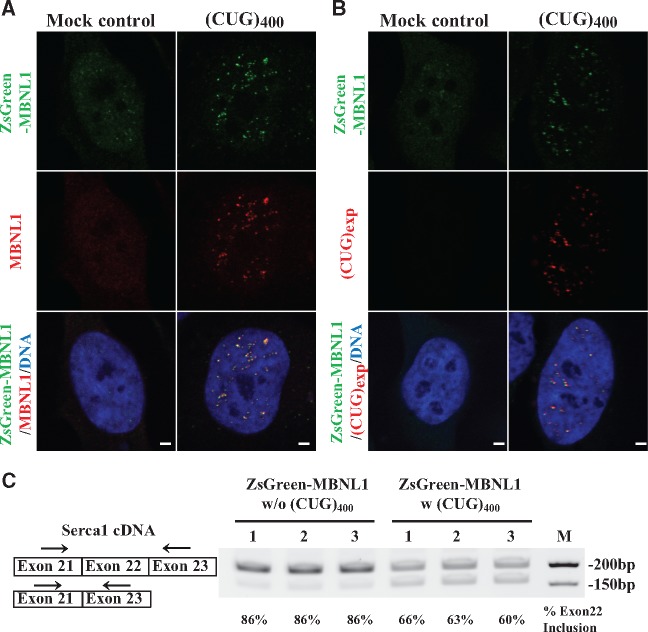
Figure 2.
Reconstitution of the DM1 phenotype in ZsGreen-MBNL1 cells. Representative fluorescent images of ZsGreen-MBNL1 cells transfected with pcDNA-DMPK-(CTG)400 plasmid or no construct. (A) Localization of MBNL1 with labeled antibody (red) and ZsGreen-MBNL1 (green) at nuclear foci in (CUG)400 expressing cells. Scale bar is 2 µm. (B) Fluorescent in situ hybridization with probes against (CUG)exp repeats (red) show ZsGreen-MBNL1 (green) is partially co-localized with CAG-Cy3 labeled RNA foci. Nucleus was stained by DAPI (blue). Scale bar is 2 µm. (C) RT-PCR analysis to detect SERCA1 exon 22 alternative splicing in ZsGreen-MBNL1 cells transfected with no plasmid or plasmid expressing (CUG)400 RNA . Exon 22+ and exon 22− transcripts are shown in the diagram on the right with RT-PCR primer sets indicated by arrows. The band intensity was quantified by ImageJ and the percentage numbers of exon 22 inclusions are listed below. Biological triplicates of each treatment are indicated by 1, 2 and 3.

