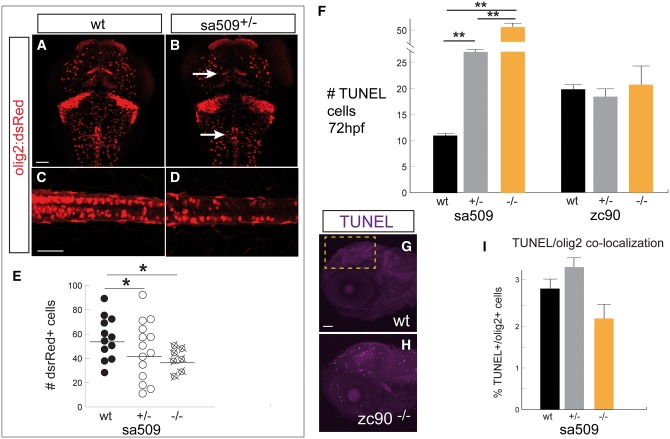
Figure 6.
Abnormal OPC development. Confocal z-stack projections, 72 hpf, scale bar 50 μm. (A–D) Representative images of Tg(olig2:dsRed) embryos, immunohistochemistry for α-dsRed, shows decreased number of olig2+ cells in the brain and spinal cord and altered patterning (arrows), quantified in (E) * P < 0.05. A-B, dorsal views of the brain, rostral to the top; (C,D), lateral views of spinal cord, rostral to the left, dorsal to the top. F) TUNEL counts in the brain, area of quantification shown in G). At 72 hpf there was a significant increase in TUNEL counts in sa509 mutants, ** P < 0.001. (G, H) Confocal images of TUNEL labeling, lateral views of the head, rostral to the left, dorsal to top. Yellow box indicates region for quantification. I) In sa509 mutants there was no significant co-localization of TUNEL+ labeling in dsRed (olig2+) cells at 72 hpf.

