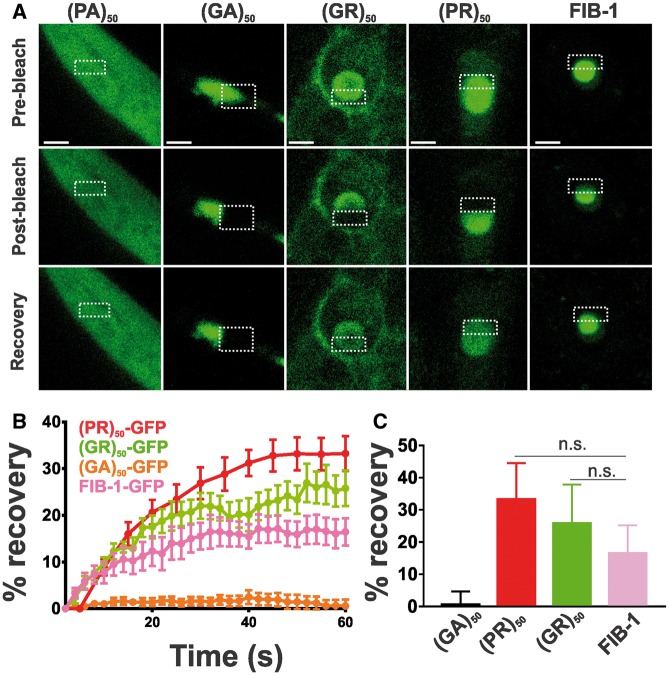
Figure 4.
Arginine-containing DPRs are not aggregates. (A) Representative images from FRAP analysis of subcellular localized DPR proteins expressed in muscle. Dashed outline indicates site of photobleaching and post-bleaching quantification. Recovery images are 150 s post-bleach. Scale bar = 2 μm. (B) Quantification of FRAP imaging. Data shown are mean ± S.E.M. from 9 to 10 datasets per genotype. (C) Average equilibrium fluorescence recovery after 60 s. Data shown are mean ± S.D. from 9 to 10 datasets per genotype. n.s. versus FIB-1-GFP (one-way ANOVA with Dunn’s multiple comparison test).

