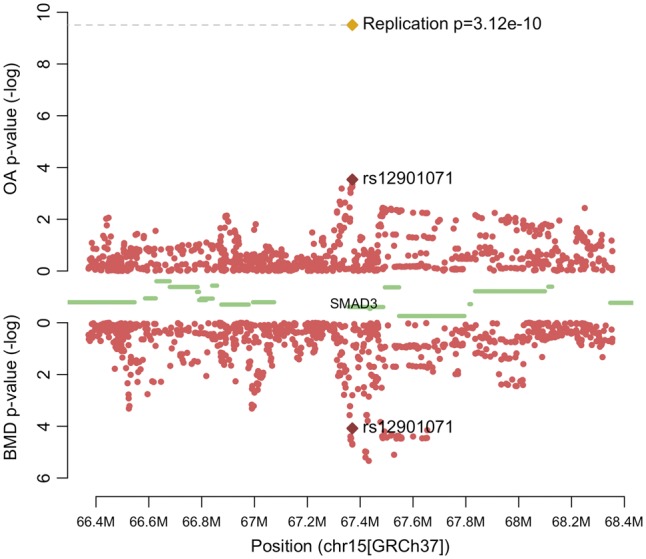
Figure 2.

Regional association plot of SMAD3. The -log(p-values) of SNPs in the arcOGEN combined osteoarthritis (OA) data (top) and GEFOS lumbar spine bone mineral density (LSBMD) data (bottom) are plotted against their chromosomal position. The meta-analysis p-value of rs12901071 is plotted as a golden diamond. Protein coding genes are represented by green bars.
