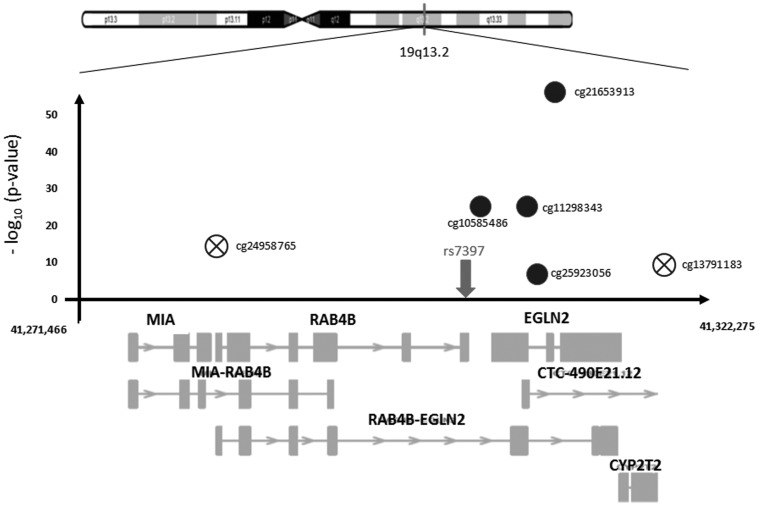
Figure 3.
Region plot of chromosome 19q13.2 with significant SNP-CpG associations. The circles represent SNP-CpG associations; X-axis shows all genes in the region; Y-axis shows negative logarithm of the P-values of the associations of CpGs with the SNP. Crossed circles represent the non-replicated associations.

