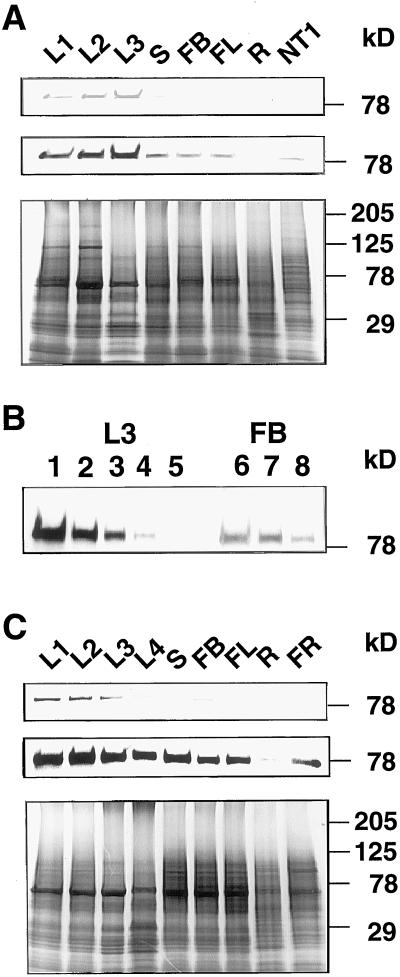
Figure 6.
Expression of MFP1 in tobacco and tomato. A, Approximately equal amounts of total protein extracts from various tobacco tissues were subjected to immunoblot analysis using the a288 antiserum. L1, Leaf 1.25 cm in length; L2, leaf 12 cm in length; L3, leaf 35 cm in length; S, stem; FB, flower bud; FL, flower; R, root; NT1, NT-1 suspension-cultured cells. The top and middle panels show a shorter and a longer exposure of the immunoblot, respectively. The bottom panel shows the Coomassie Brilliant Blue staining of a replica gel. B, Titration of L3 leaf extract and flower bud extract. Lane 1 was loaded with the same amount (1×) L3 protein extract that was used in A; lanes 2, 3, 4, and 5 were loaded with 0.5×, 0.25×, 0.125×, and 0.062× the amount loaded in lane 1, respectively. Lane 7 was loaded with the same amount (1×) of flower bud protein extract that was used in A. Lanes 6 and 8 were loaded with 2× and 0.5× the amount in lane 7, respectively. C, Approximately equal amounts of total protein extracts from various tomato tissues were subjected to immunoblot analysis using the a288 antiserum. L1, Leaf 1.5 cm in length; L2, leaf 9 cm in length; L3, leaf 13 cm in length; L4, leaf 21 cm in length; S, stem; FB, flower bud; FL, flower; R, root; FR, ripening fruit. The top and middle panels show a shorter and a longer exposure of the immunoblot, respectively. The bottom panel shows the Coomassie Brilliant Blue staining of a replica gel. Molecular mass markers are indicated on the right.

