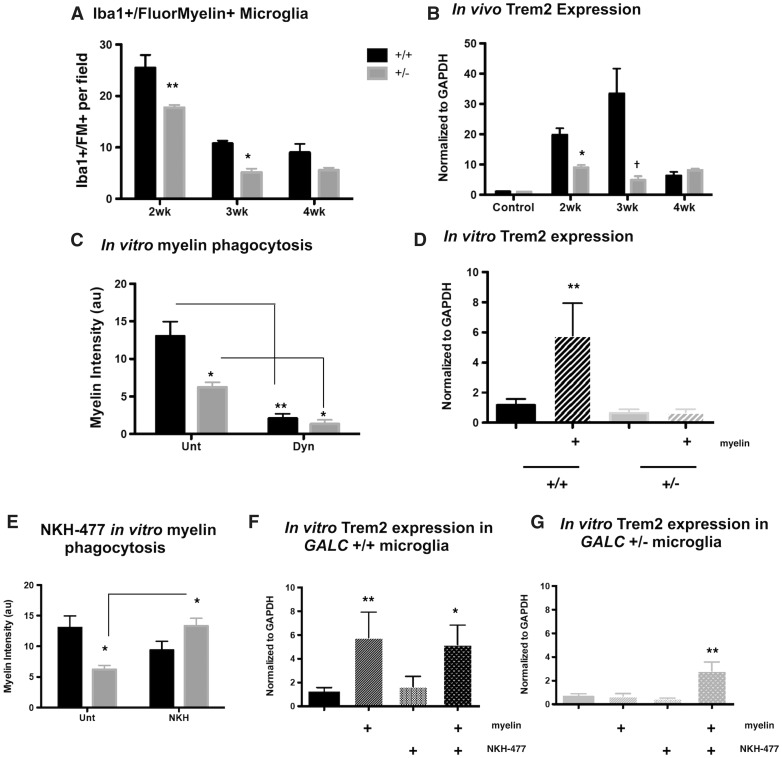
Figure 4.
GALC +/− microglia have reduced myelin phagocytosis in vivo following cuprizone exposure and in vitro. (A) Quantification of Iba-1 and FluoroMyelin staining in the corpus callosa of three month old WT and GALC+/− littermates after 4 weeks exposure to 0.3% cuprizone diet (N = 3 from different litters per time point). Data are represented as the average number of Iba-1+/FluoroMyelin+ cells per field of view. (B) Quantification of the relative levels of mRNA of Triggering receptor on myeloid cells 2 (Trem2). Data are normalized to GAPDH and represented as fold change over WT untreated controls (N = 3 from different litters). (C) Quantification of myelin phagocytosis: isolated microglia from three-month-old WT and GALC +/− littermates were loaded with Di-I (Invitrogen) labeled myelin overnight and imaged (N = 3 from different litters). Myelin phagocytosis was quantified by measuring fluorescent intensity. Cells were pretreated with Dynasore (100μM; Sigma) 1 h prior to myelin debris loading as a control. (D) Quantification of the relative levels of mRNA of Trem2 in isolated WT and GALC +/− microglia either untreated or treated overnight with myelin debris. Data are normalized to GAPDH and represented as fold change over WT untreated controls (N = 3 from different litters). (E) Quantification of myelin phagocytosis as described in (C); cells were left either untreated or treated with NKH-477 (1μM; Tocris) upon myelin loading. (F,G) Quantification of the relative levels of mRNA of Trem2 in isolated WT (F) and GALC +/− (G) microglia either untreated or treated overnight with myelin debris, with or without the addition of NKH-477 (1μM). Data are normalized to GAPDH and represented as fold change over WT untreated controls (N = 3 from different litters). Data for all graphs displayed as mean ± SEM. *P < 0.05, **P < 0.01, †P < 0.001 versus WT recovery-matched animals; *P < 0.05, **P < 0.01 versus WT untreated microglia.

