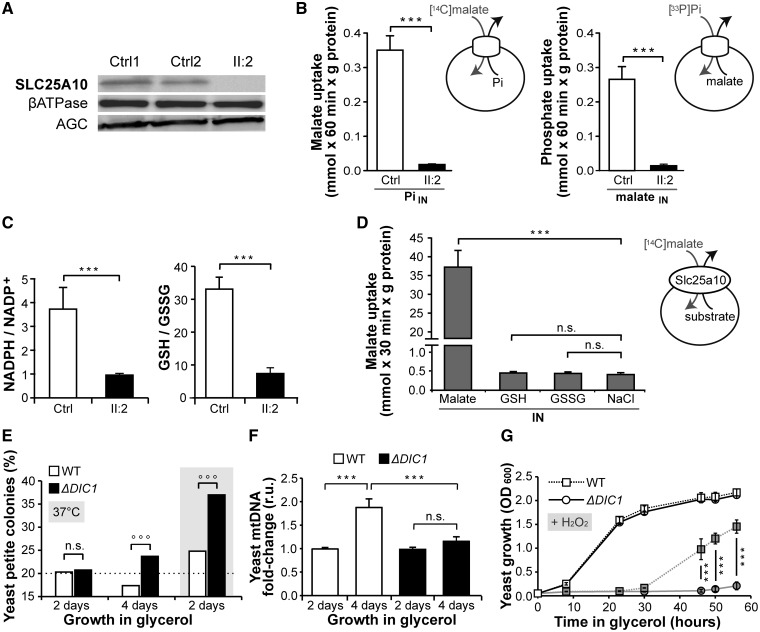
Figure 2.
SLC25A10 protein and functional analyses. (A) Western-blot of primary fibroblast mitochondrial extracts (30 μg of protein) in patient (II: 2) and two control cell lines (Ctrl1 and Ctrl2). (B) Transport activity of SLC25A10 in fibroblast mitochondrial extracts of patient (II: 2) and control (Ctrl). Liposomes were reconstituted with mitochondrial extracts, preloaded with excess of Pi or malate (20 mM) and incubated with radio-labeled [14C]malate or [33P]phosphate (1 mM), respectively, for 60 min. Pi: phosphate. (C) Mass spectrometry quantification of NADPH and GSH (reduced forms) and NADP+ and GSSG (oxidized forms), reported as reduced/oxidized form ratios, in the fibroblasts of patient (II: 2) and control (Ctrl). (D) Lack of transport of GSH and GSSG by DIC (Slc25a10). Liposomes were reconstituted with the recombinant purified rat DIC, preloaded with excess of malate, GSH or GSSG or NaCl (10 mM) and incubated with radio-labeled [14C]malate (0.5 mM) for 30 min. (E) Percentage of “petite” respiratory-deficient yeast colonies generated from S. cerevisiae knockout strain (ΔDIC1) and isogenic wild-type strain (WT) after 2 or 4 days of growth in glycerol at 30 °C or 37 °C. ∼1000 colonies were screened per strain per assay. °°°: binomial test P-value<0.05, n.s.: not significant. (F) Yeast quantitative PCR analysis of relative mtDNA copy number after 4 days of growth in glycerol compared with 2 days. (G) Yeast growth curves in glycerol for WT and ΔDIC1 in absence (open symbols) or in presence (filled symbols) of H2O2 (2.5 mM). Data are presented as mean+SEM of at least three experiments except for Figure 2E, ***: non parametric wilcoxon test P-value<0.05, n.s.: not significant.

