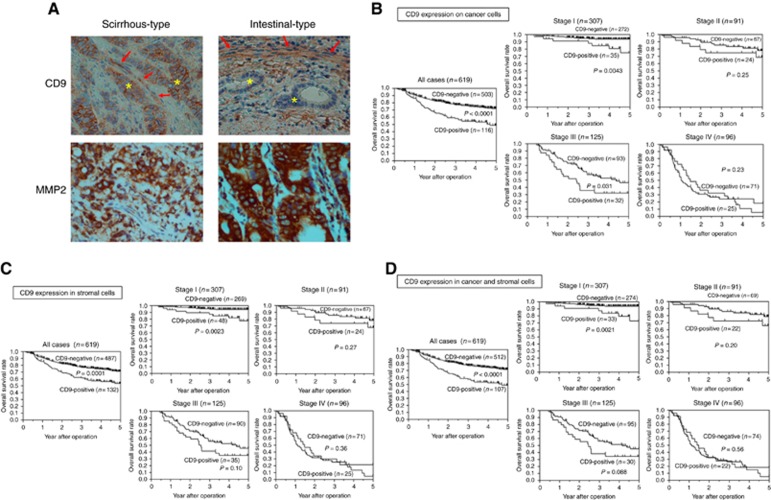
Figure 5.
CD9 expression and survival of patients with gastric cancer. (A) Representative pictures of CD9 and MMP2 expression. CD9 was mainly expressed in the cytoplasm of fibroblasts (arrows) and the cell membrane of scirrhous-type gastric cancer cells (asterisks). CD9 was not expressed on the intestinal-type gastric cancer cells (asterisks) even when CD9 was found in the cytoplasm of the same patient’s fibroblasts (arrows). (B) Survival of gastric cancer patients with CD9 expression on cancer cells. The Kaplan–Meier survival curve indicates that the OS of patients with CD9-positive cancer cells was significantly worse than that of patients with CD9-negative expression (P<0.0001). In patients at stage I and stage III, the OS values of patients with CD9-positive cancer cells were significantly worse than those with CD9-negative expression. (C) OS of patients with CD9-positive expression in stromal cells was significantly worse than those with CD9-negative expression, especially at stage I (P=0.0023). (D) Patients with CD9 positivity in both cancer and stromal cells had a significantly worse prognosis than the group with negative expression in one or both cell types (P<0.0001), especially at stage I (P=0.0021). A full colour version of this figure is available at the British Journal of Cancer journal online.

