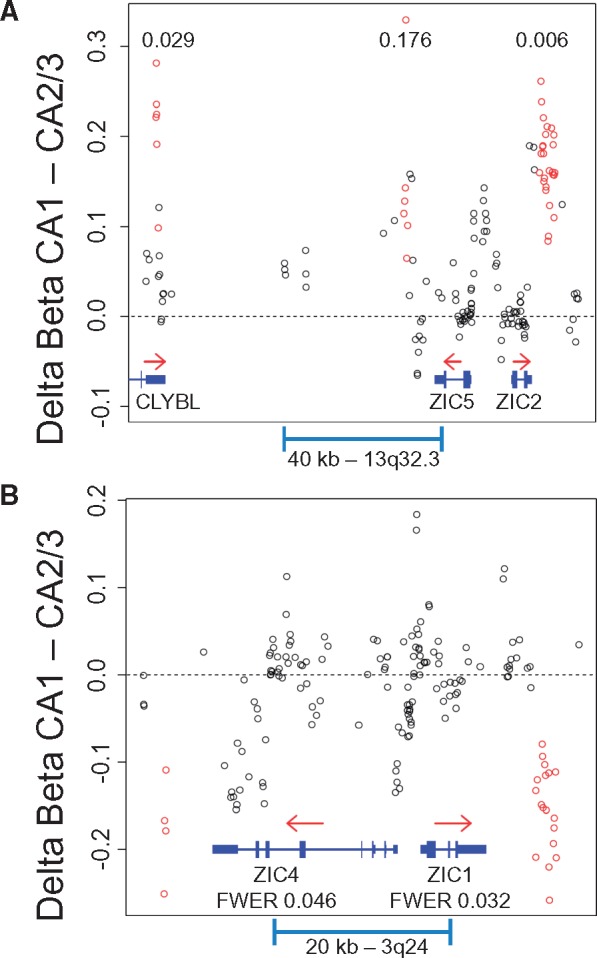
Figure 3.

Differentially methylated regions associated with the ZIC gene family tandem gene pairs. DMRegions at the ZIC2 and ZIC5 locus on Chromosome 13 (A) and at the ZIC1 and ZIC4 locus on Chromosome 3 (B) are depicted with genomic location plotted on the X-axis, and delta beta value (CA1 - CA3/2) plotted on the Y-axis. Note that the DMRegion downstream of ZIC5 did not reach significance as defined by FWER < 0.05 (FWER 0.176, p value = 0.001). Open circles represent differences in averaged subfield methylation levels at individual CpG sites, with red circles found within identified DMRegions. Gene location and structure are depicted in blue, with red arrows indicating the direction of transcription. Numbers within plots indicate the FWER of the associated DMRegion.
