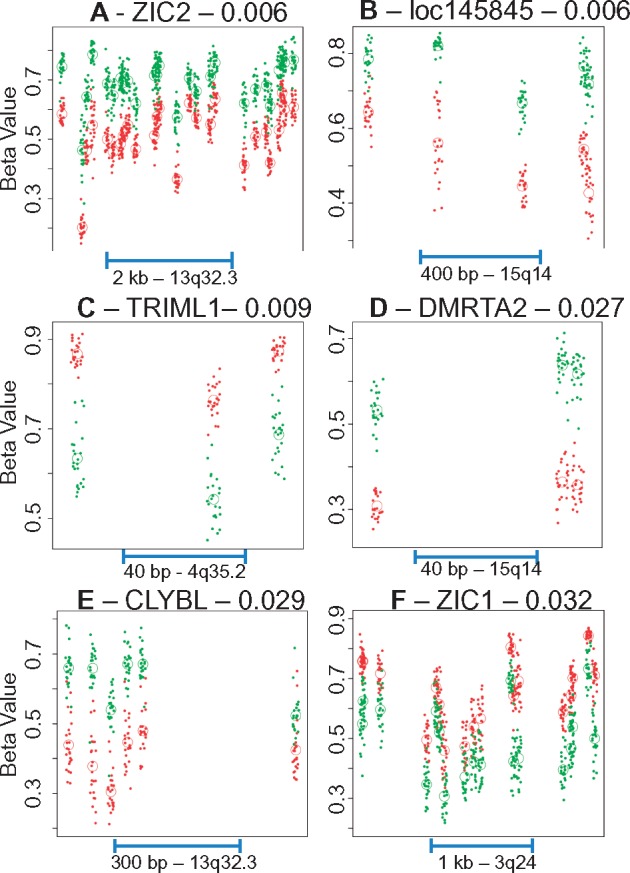
Figure 4.

Methylation profiles of individual differentially methylated regions. Each plot depicts the methylation profiles of all 24 cases at a single identified genome-wide significant DMRegion plotted as a function of genomic location. Each point represents the beta value at a single CpG in a single case, with green points indicating CA1 measurements and red points indicating CA3/2 measurements. Open circles indicate the average beta value at a single CpG for all cases in that subfield. Genomic location and length of scale bar are indicated at the base of each plot. Similar plots for the remaining five significant DMRs, as well as ZIC5, are included in Supplementary Material, Figure S3.
