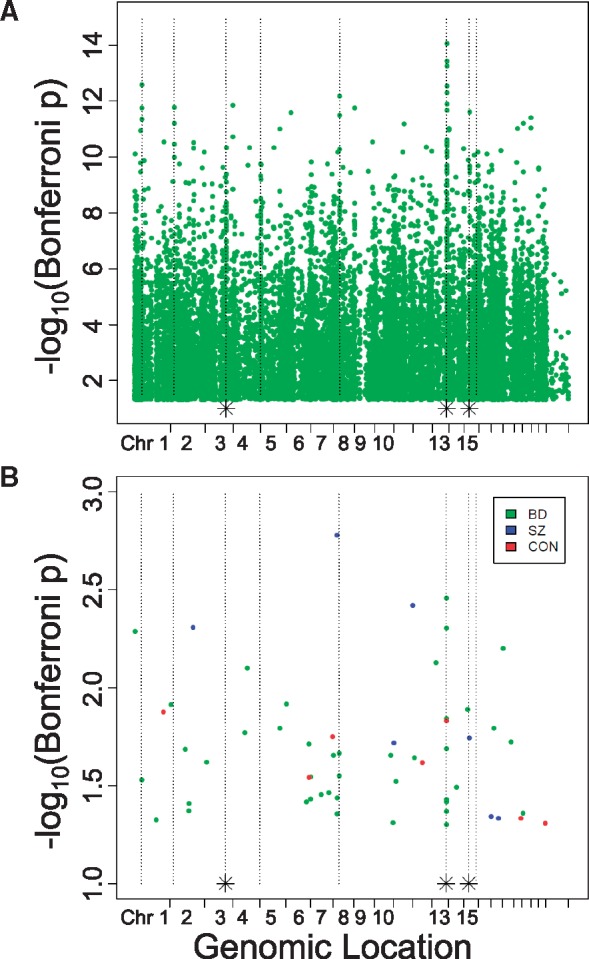
Figure 6.

Differentially methylated positions in CA3/2 versus CA1. DMPositions with Bonferroni-corrected P-value less than 0.05 identified by single-probe analysis in all 24 cases together (A) and in separate diagnostic categories (B) are plotted with genomic location indicated on the X-axis, and -log10(Bonferroni-corrected P-value) on the Y-axis. As in Figure 2b, dotted vertical lines indicate the genomic location of DMRegions identified in the pooled analysis of all diagnoses together, and dotted lines with an asterisk at their base indicate the location of two distinct DMRegions located too closely together to be resolved on this plot.
