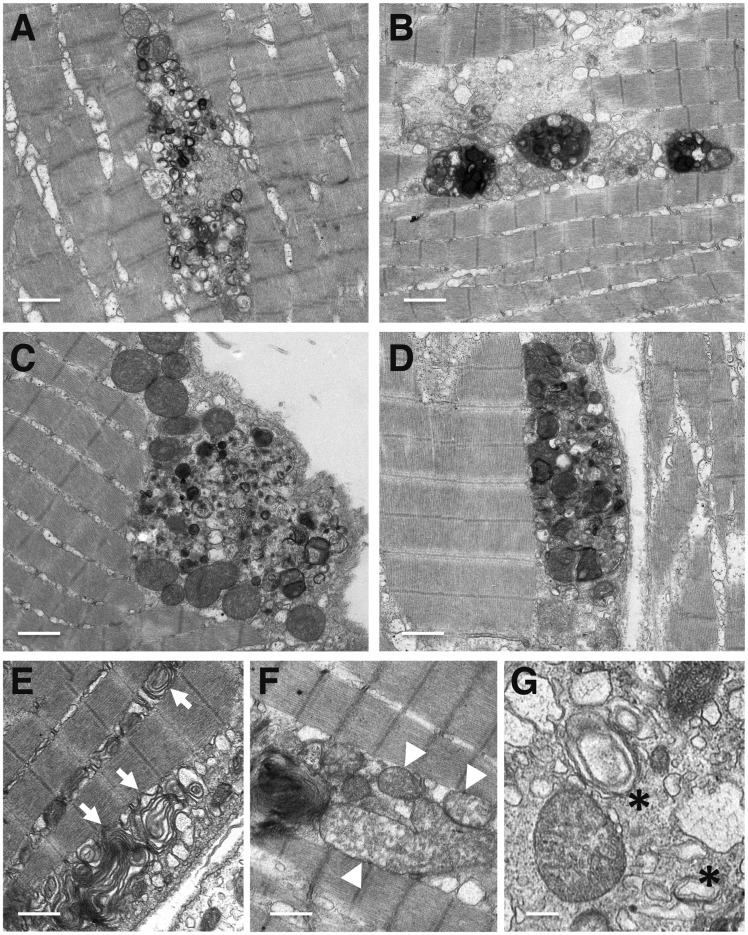
Figure 4.
Autophagy disruption in skeletal muscle of mcoln1ab−/− fish (A–G) Muscle samples of 12-month-old mcoln1ab−/− zebrafish were analyzed by transmission electron microscopy (TEM). Images show autophagic debris containing electro-dense inclusions, organelles and other cytoplasmic contents in mcoln1ab−/− skeletal muscle. Arrows in (E) indicate multi-lamellar structures; arrowheads in (F) point to abnormal mitochondria; and the asterisks in (G) denotes autophagosomes. Scale bar for (A–F), 1 μm. Scale bar for (G), 250 nm.

