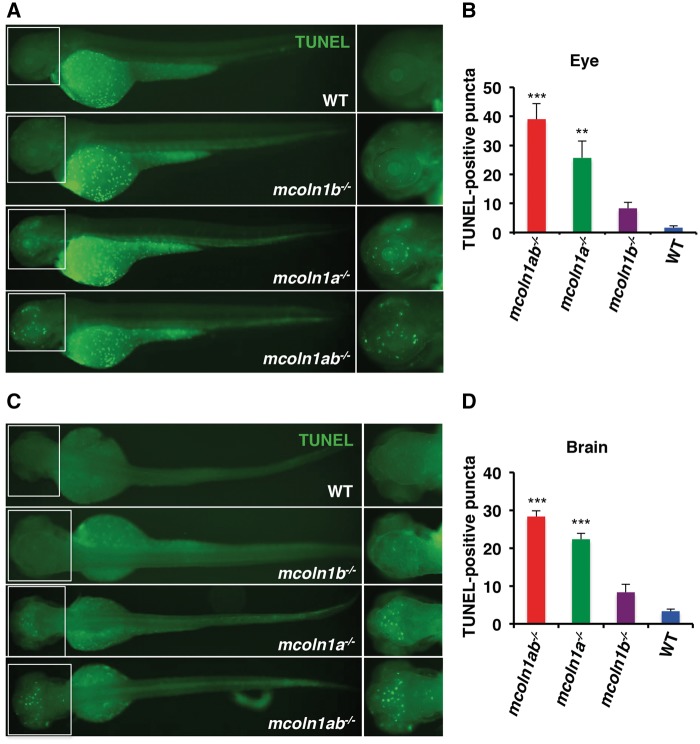
Figure 6.
Apoptosis in mcoln1 mutant embryos at 3 dpf. (A) Whole mount TUNEL staining in zebrafish embryos at 3 dpf for WT, mcoln1a−/−, mcoln1b−/−, and mcoln1ab−/− with the orientation to show the eye staining. (B) Quantification of TUNEL positive signals in the eyes of different genotypes. Data are shown as mean ± SD and represent 6 eyes counted. The data were analyzed using paired t test (***P < 0.001; **P < 0.01). (C) Whole mount TUNEL staining in zebrafish embryos at 3 dpf with different genotypes with the orientation to show the brain staining. (D) Quantification of TUNEL positive signals in the head of different genotypes. Data are shown as mean ± SD and represent 3 heads counted. The data were analyzed using paired t test (***P < 0.001).

