Figure 6.
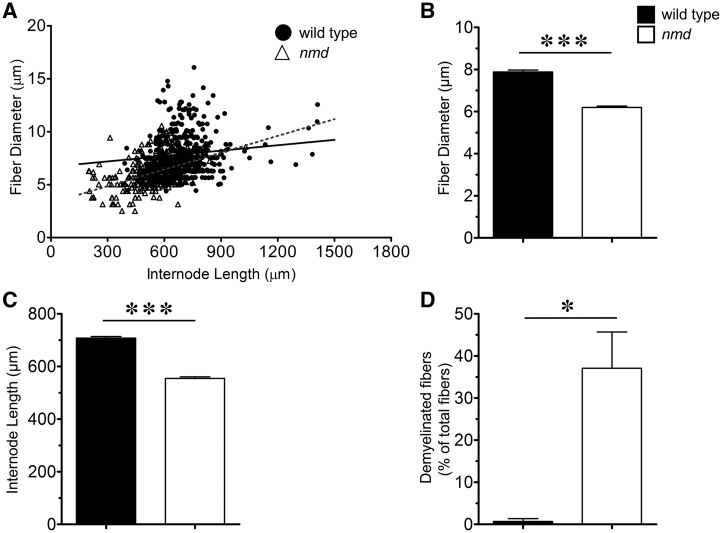
Pathology in tibial nerve from nmd mice. (A) Scatter plots showing the correlation between internode length and fiber diameter of nmd and wild type controls. r2 values of regression correlations showed a significant shift towards smaller fiber diameter with shorter internode lengths in the population of nmd fibers compared with wild-type controls (P < 0.0001). (B) Mean fiber diameter comparisons revealed a significant (P = 0.0001) decrease in nmd fiber diameter (6.19 ± 0.07 µm) compared to wild-type fiber diameter (7.89 ± 0.09 µm). (C) Mean internode length comparisons revealed a significant (P < 0.0001) decrease in nmd (554.8 ± 5.69 µm) compared to wild-type (707.6 ± 6.1 µm) internode length. (D) Quantification of abundance of fibers with myelin alterations (myelin fragmentation, segmental demyelination, complete demyelination) revealed a significant increase (0 = 0.0135) in percent of total fibers teased with myelin defects in nmd (37%) compared to wild-type controls (0.6%). Individual comparisons were analyzed by Student’s t-test. Data expressed as mean ± SEM. *P < 0.05. n = 3 animals per treatment.

