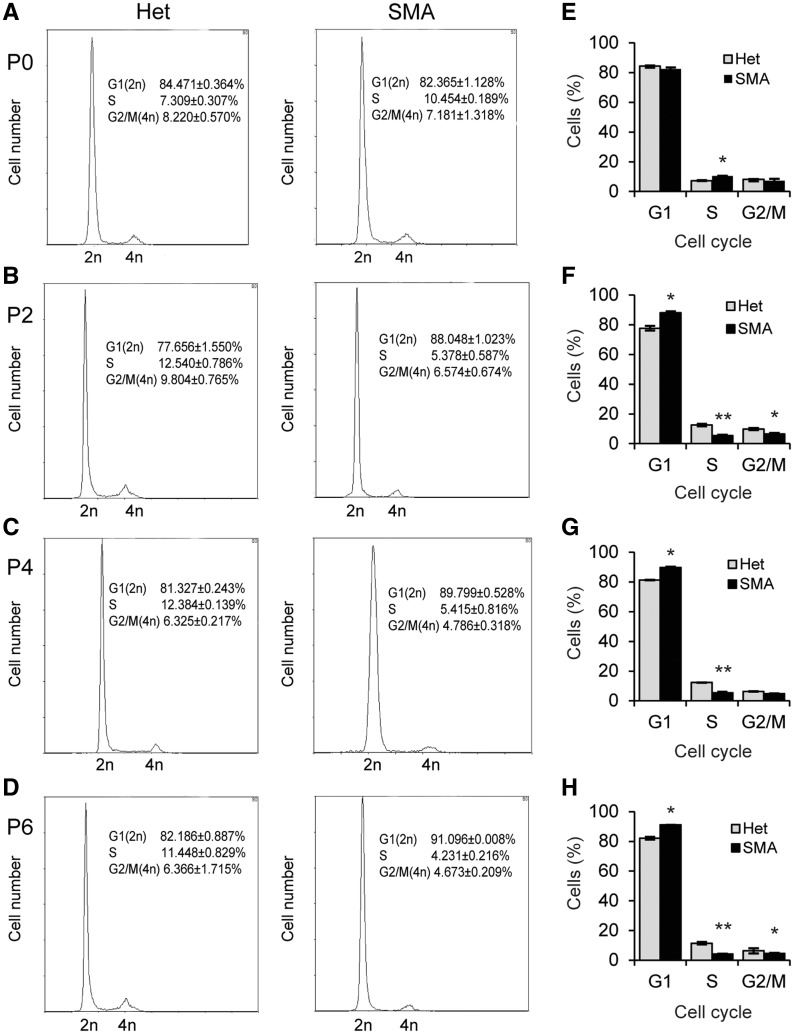
Figure 3.
Cell cycle of SMA cardiomyocytes was analysed by flow cytometry. (A–D) DNA profiles of cardiomyocytes isolated from SMA mice aged P0, P2, P4, or P6. Heterozygous littermates (Het) were used as controls (n = 3). Cells were stained with propidium iodide. (E–H) Histograms of cell-cycle data from (A–D). *P < 0.05 **P < 0.01.

