Figure 1.
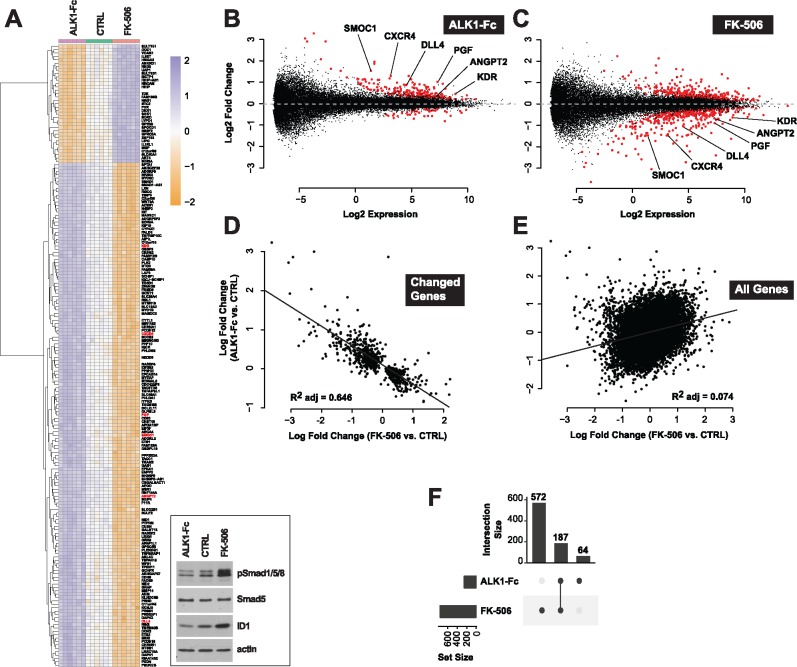
Tacrolimus mimics ALK1-mediated gene expression control. (A) RNA-Seq heat map of gene expression changes in HUVECs treated or not (CTRL) for 24 h in complete medium (conditioned for 2 days) with ALK1-Fc (1 μg/ml) or tacrolimus (FK-506, 0.3 μM) (n = 6). Inset, cell extracts were analyzed by western blotting (WB) using antibodies directed against the indicated proteins. (B, C) RNA-Seq MA-plots displaying all differentially expressed transcripts in ALK1-Fc-treated (B) and FK-506-treated (C) HUVECs. Genes with a FDR < 0.01 are shown in red. Genes unchanged by treatment are expected to lie on the horizontal dashed line at log2 fold change = 0. Low expression values reflect experimental measurement noise. Genes discussed in the text were annotated on the plots. (D, E) RNA-Seq scatter plots comparing gene expression changes (log fold change) between ALK1-Fc and FK-506 treatments for transcripts differentially expressed by either treatment (FDR < 0.01, D) and for all transcripts (E). (F) RNA-Seq UpSet plot showing the size of set intersections for transcripts differentially expressed by ALK1-Fc or FK-506 treatments. Bars indicate how many transcripts were differentially expressed in each labelled condition. Lines connect dots to indicate set intersection. Specifically, 572 + 187 transcripts were differentially expressed upon FK-506 treatment, of which 187 were also differentially expressed when HUVECs were treated with ALK1-Fc. 64 genes were differentially expressed following ALK1-Fc treatment, but not in the other condition.

