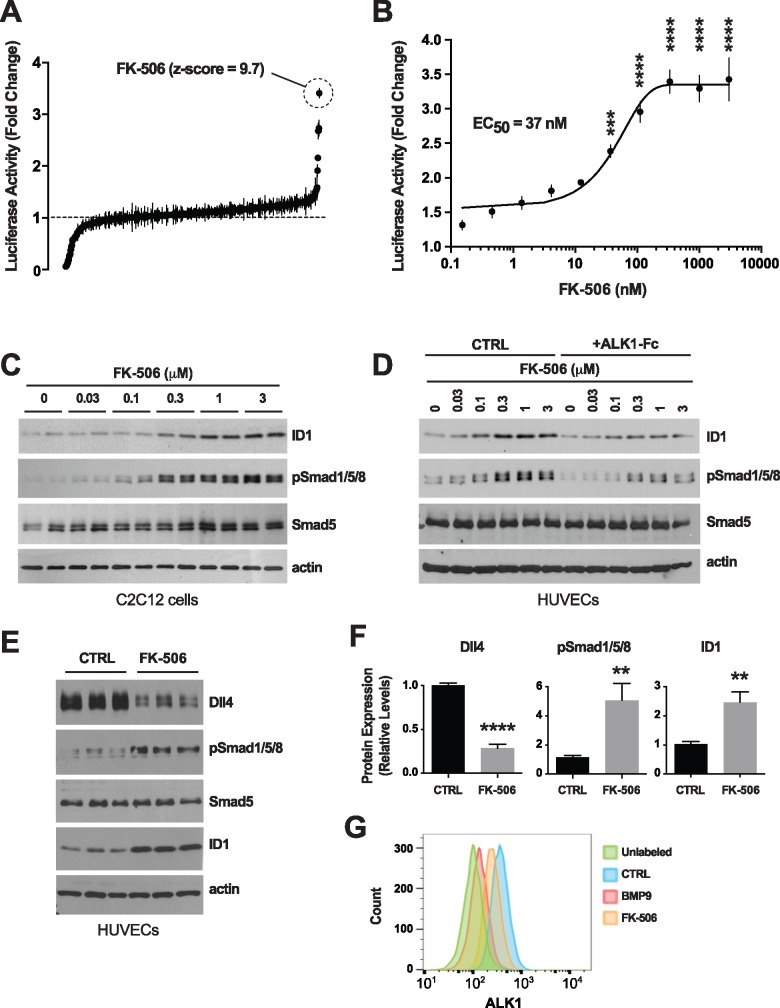
Figure 3.
Identification and validation of tacrolimus as a Smad1/5/8 signaling activator. (A) NCC screen using Id1 transactivation luciferase assay in C2C12BRA cells. Drugs were tested in duplicate at 3 μM on cells maintained for 24 h in depleted medium containing 0.1% FBS and 0.5 ng/ml BMP9 (BMP9 EC50). Data (fold change mean ± range) are ranked by mean score and were normalized to DMSO control. (B) Luciferase activity in C2C12BRA cells treated with different concentrations of tacrolimus (FK-506) in depleted medium supplemented with BMP9 at EC50, as in (A). Data represent mean ± SEM (n = 4); ***P < 0.001, ****P < 0.0001; one-way ANOVA, Bonferroni's multiple comparisons test. (C–E) C2C12 cells (C) and HUVECs (D and E) were treated or not (CTRL) for 24 h in complete medium (conditioned for 2 days) with ALK1-Fc (1 μg/ml, D) or tacrolimus at the indicated concentrations (C and D) or 0.3 μM (E). Cell extracts were analyzed by WB using antibodies directed against the indicated proteins. (F) Densitometric analyses and quantification of Dll4, pSmad1/5/8, and ID1 relative levels in n = 3 independent experiments, as in (E). Data represent mean ± SEM; **P < 0.01, ****P < 0.0001; Student’s t-test. (G) Flow cytometry analysis of surface ALK1 expression in HUVECs treated or not (CTRL) for 24 h in complete medium (conditioned for 2 days) with BMP9 (10 ng/ml) or tacrolimus (0.3 μM).

