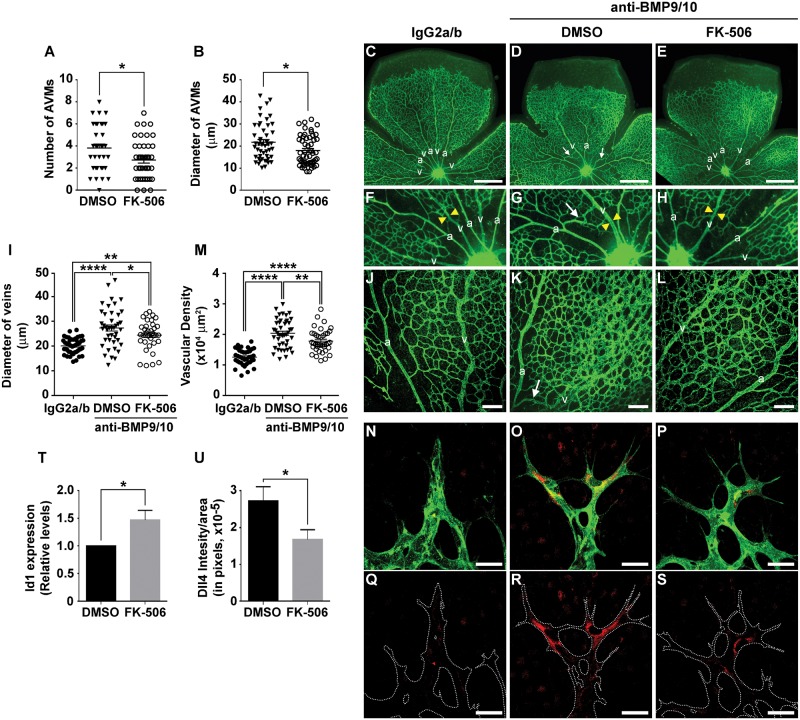
Figure 5.
Tacrolimus improves vascular pathology in the BMP9/10-immunoblocked retina. (A and B) AVM number (A) and AVM diameter (B) in the retinal vasculature of P6 pups treated via the transmammary route with BMP9 and BMP10 blocking antibodies [see Methods and Ref. (47)], and treated with tacrolimus (FK-506, 0.5 mg/kg/d) or vehicle (DMSO). Data represent mean ± SEM per retina (n = 10–20 pups per group); *P < 0.05; Student’s t-test (A) and Mann Whitney U test (B). (C–H) and (J–L) Representative images of retinas stained with fluorescent isolectin B4 from pups injected or not (DMSO) with tacrolimus (FK-506, 0.5 mg/kg/d), and treated via the transmammary route with control IgG2a/b (C, F and J) or BMP9/10 blocking antibodies (D, E, G, H, K and L). Higher magnifications in (F–H and J–L) show retinal vein diameter (F–H, see yellow arrowheads) and retinal vasculature fields (plexus area) between an artery (a) and a vein (v) (J–L). Arrows in (D, G and K) denote AVMs. (I, M) Scatter plots measuring retinal vein diameter (I) and retinal vascular plexus density (M) in pups treated as in (C–E). Data represent mean ± SEM (n = 6–8); *P<0.05, **P<0.01, ****P<0.0001; one-way ANOVA, Tukey’s multiple comparisons test. (N–S) Histochemistry analysis of the vascular front of P6 retinas treated as in (C–H) and stained with fluorescent isolectin B4 (N–P, green) and anti-Dll4 antibody (N–S, red). (T) Retinal ECs isolated with anti-CD31 microbeads from pups treated as in (A) were analyzed for Id1 mRNA levels by RT-qPCR. The results are expressed as relative levels of the control condition (n = 3 determinations). (U) Quantification of Dll4 levels in 3 experiments as in (R and S). Data in (T and U) represent mean ± SEM (n = 3–5); *P < 0.05; Student’s t-test (T) and Mann–Whitney U test (U). Scale bars, 500 μm (C–E), 100 μm (J–L), 30 μm (N–S).

