Figure 3.
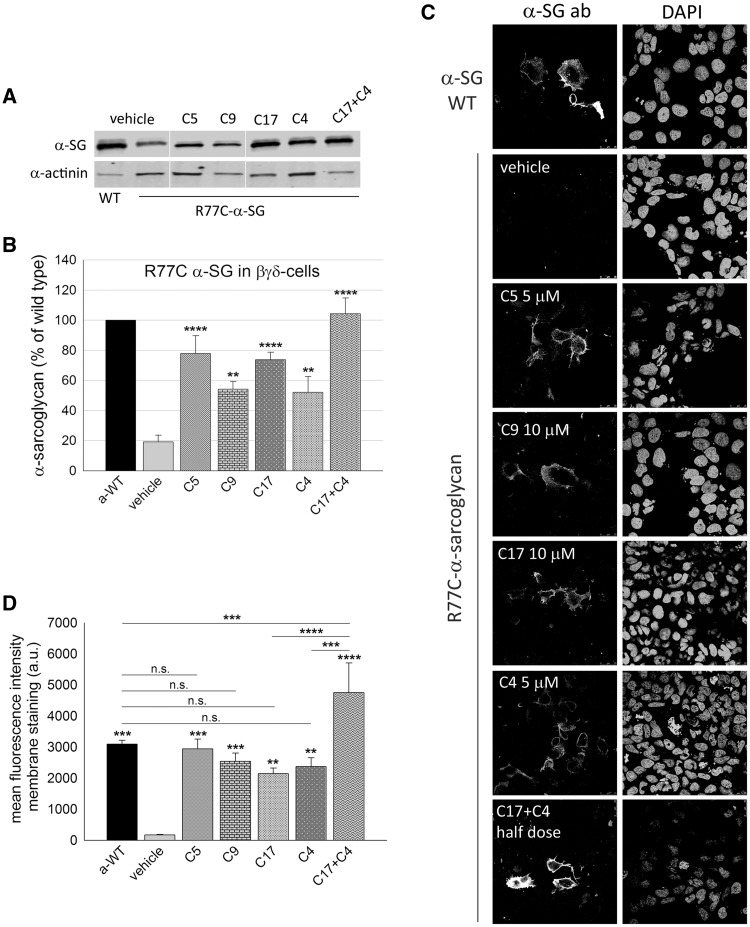
Rescue of the folding-defective R77C-α-SG by means of CFTR correctors. (A) Western blot of protein lysates from βγδ-cells transiently expressing R77C-α-SG and treated for 24 h with corrector C5 5 µM, C9 10 µM, C17 10 µM, C4 5 µM. One sample was treated with the combination of corrector C17 and C4 (each one-half dose). Cells expressing wild type-α-SG were utilized as positive control. Membrane were probed with antibodies against α-SG and α-actinin, used as loading control. (B) quantification by densitometric analysis of α-SG protein bands on at least three independent Western blot experiments. The average amount of α-SG (± SEM) is shown as percentage of the protein content in cells expressing the wild type form. Statistical analysis was performed by One-way ANOVA test - multiple comparisons Dunnett test; **P ≤ 0.01; ****P ≤ 0.0001. (C) IF confocal analysis of βγδ-cells expressing R77C-α-SG and treated for 24 h with the indicated correctors. Intact cells (not permeabilized) were immune-decorated with an anti α-SG antibody, recognizing an extracellular epitope, revealed by the secondary Alexa Fluor 594-conjugated anti-mouse antibody. Cells expressing wild type-α-SG are shown as positive control. On the right of each image is reported the same field with nuclei stained by DAPI. Images were recorded with a Leica SP5 laser scanning confocal microscope at the same setting conditions and magnification. (D) mean fluorescence intensity of membrane staining of βγδ-cells expressing R77C-α-SG treated for 24 h with vehicle (negative control) or the indicated correctors; βγδ-cells expressing WT-α-SG were used as positive control. Fluorescence values from at least three independent experiments, performed in triplicate, were recorded by using the ImageXpress microscope system. Mean values (± SEM) were normalized for the number of cells positive for both α-SG and DAPI under permeabilization condition to consider transfection efficiency. Statistical analysis was performed by One-way ANOVA test - multiple comparisons Bonferroni test; n.s., P > 0.05; **P ≤ 0.01; ***P ≤ 0.001; ****P ≤ 0.0001.

