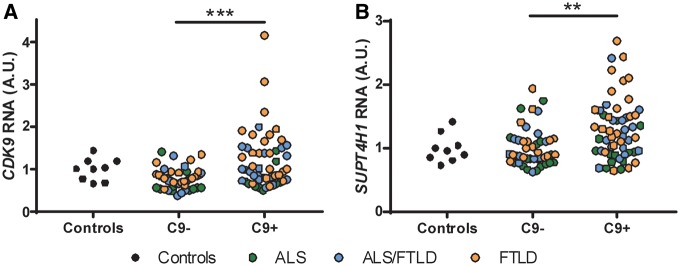
Figure 4.
CDK9 and SUPT4H RNA levels are elevated in C9orf72-positive cases. The levels of CDK9 (A) and SUPT4H1 (B) RNA were assessed by qRT-PCR as described in methods for our large cohort of cases (Supplementary Material, Table S1). Statistical analyses were performed to compare all groups using a One-way ANOVA followed by Dunn’s multiple comparison test, **P < 0.01, ***P < 0.001. Of note, results from a subsequent linear regression model were also significant (C9+ vs. C9-: SUPT4H, P = 0.0288; CDK9, P = 0.0059), while correcting for disease duration, disease subtype, and age at death.

