Figure 4.
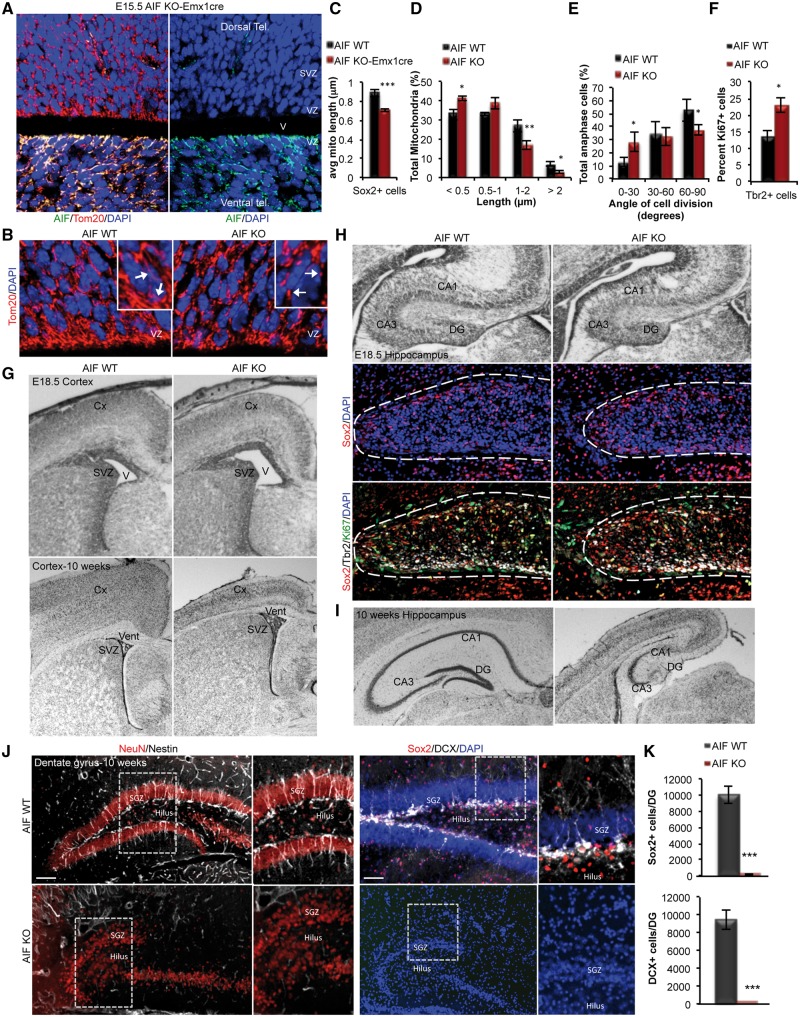
Loss of mitochondrial function causes age-dependent defects in forebrain development, depletion of NSCs and loss of adult neurogenesis in the DG. (A) Representative confocal images showing loss of AIF expression restricted to the dorsal cortex in AIF-Emx1Cre E15.5 embryos. (B) Representative confocal images of mitochondrial morphology in coronal sections of AIF control and knockout E15.5 developing cortex. Mitochondria were visualized by Tom20 and insets represent zoomed views of mitochondria. (VZ; ventricular zone). (C and D) Average mitochondrial length and mitochondrial length distribution from (B) was quantified and represented as mean and SD (n = 3 independent samples). (E) Measurements of the division angle of Sox2+ anaphase cells in E15.5 coronal sections for the indicated genotypes and presented as mean and SD (n = 3 individual samples). (F) Quantification of DCX+ neuroblasts co-labeled with Ki67 (proliferation marker) in E15.5 control and AIF knockouts. Data presented as mean and SD (n = 3 independent samples). (G) Cresyl violet stained coronal sections of E18.5 and 10-week adults with the indicated genotypes showing the cortex. (V; ventricle, SVZ; subventricular zones, Cx; cortex). (H and I) Cresyl violet stained coronal sections of E18.5 and 10-week adults showing the hippocampus. Representative confocal immunofluorescence images demonstrate zoomed views of the DG at E18.5 containing NPCs (Sox2 and Tbr2 labelled cells) (DG; dentate gyrus, vent; ventricle, svz; subventricular zones, Cx; cortex). (J and K) Representative confocal images of 10-week control and AIF knockout coronal sections of the dentate gyrus (DG) immunostained with Sox2 and Nestin (uncommitted cells), DCX (neuroblasts) and NeuN (mature neurons). Total Sox2+ and DCX+ cells in the entire DG was quantified and presented as mean and SD (n = 3 individual samples). Scale = 100 μm. *P < 0.05; ***P < 0.001 (Student’s t-test).

