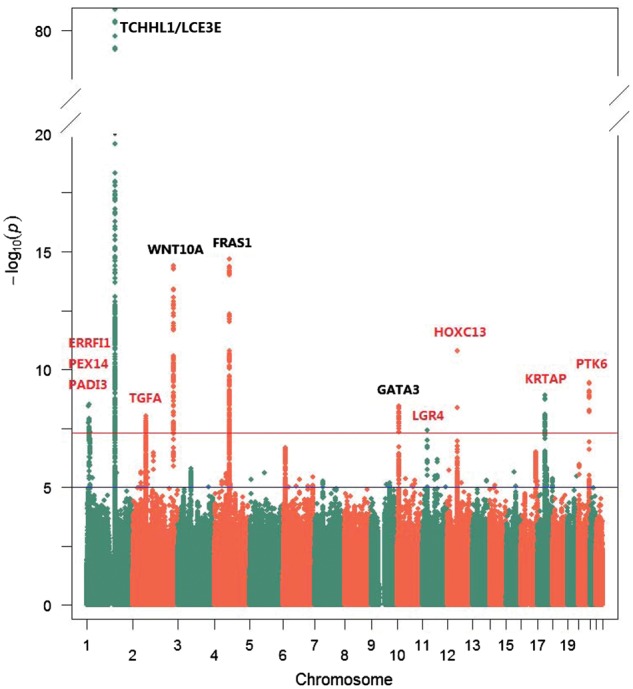
Figure 1.

Manhattan plot of meta-analysis of three GWASs for human hair shape in Europeans from QIMR, TwinsUK and RS (totaling 16, 763 subjects). The −log10 P values for association were plotted for each SNP according to its chromosomal position according to assembly GRCh37.p13. Previously known genes with genome-wide significant association in the present study are noted using black text above the figure and genes in the newly identified loci are noted in red. Genome-wide significance threshold (P = 5e-8) is indicated as a red line, while the suggestive significance threshold (P = 1e-5) is indicated as a blue line.
