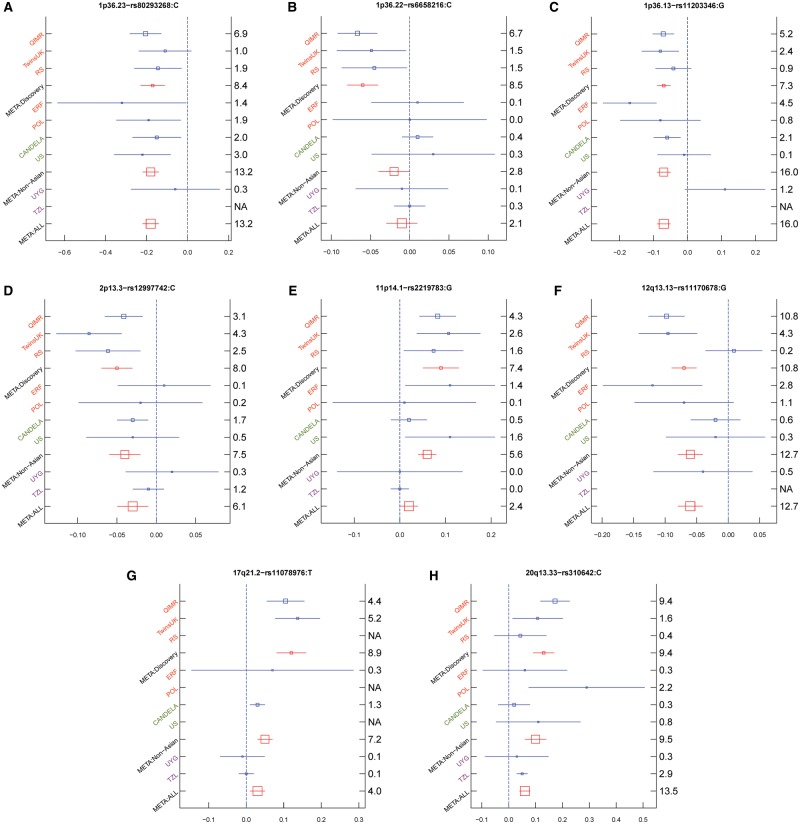
Figure 3.
Effect sizes for the derived allele at index SNPs (Table 1) in eight novel genomic regions associated with hair shape variation in 9 cohorts and a meta-analysis of all 9 cohorts (META). (A) 1p36.23—rs80293268; (B) 1p36.22 – rs6658216; (C) 1p36.13—rs11203346; (D) 2p13.3—rs12997742; (E) 11p14.1 – rs2219783; (F) 12q13.13—rs11170678; (G) 17q21.2—rs11078976; (H) 20q13.33—rs310642. Orange color indicates European cohorts, green color indicates admixed European cohorts, and purple color indicated East Asian. META: Discovery, meta-analysis of 3 European cohorts (QIMR, TwinsUK and RS), META: Non-Asian, meta-analysis of European cohorts (QIMR, TwinsUK, RS, ERF, and POL) and admixed European cohorts (CANDELA and US), and META: ALL indicates meta-analysis of all 9 cohorts (QIMR, TwinsUK, RS, ERF, POL, CANDELA, US, UYG, and TZL). Blue boxes represent linear regression coefficients (x-axis) estimated in each cohort. Red boxes represent effect sizes estimated in the combined meta-analysis. Box sizes are proportional to sample size. Horizontal bars indicate a 95% confidence interval of width equal to 1.96 standard errors. The right y-axis indicates P values in each cohort on –log10 scale. Similar plots for regions previously associated with hair shape are shown in Supplementary Material, Figure S6.

