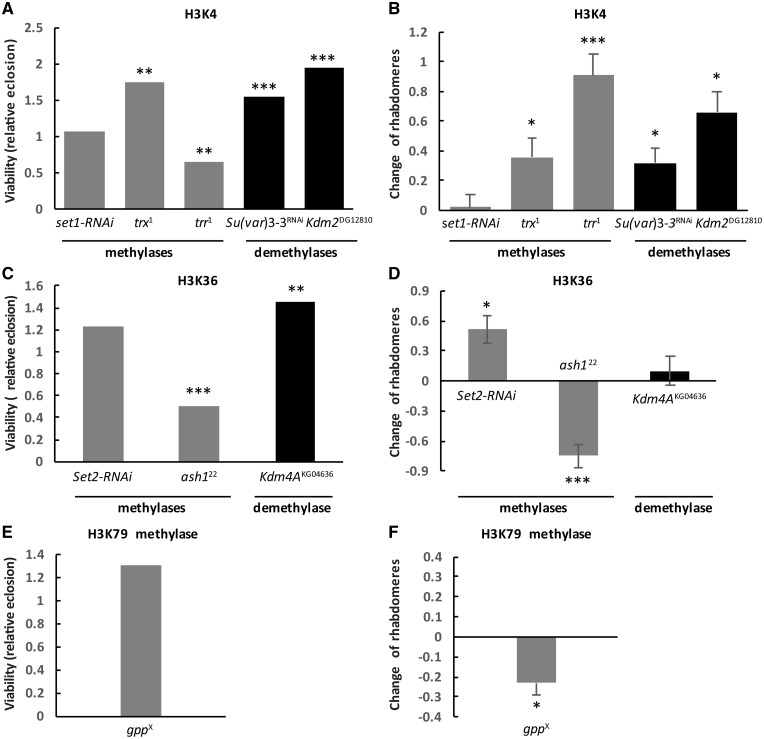
Figure 1.
Methylases and demethylases acting on active marks H3K4 (A and B), H3K36 (C and D) and H3K79 (E and F) had varying effect on HD pathology. The graphs on the left show the effects of heterozygous loss of (A) H3K4, (C) H3K36, or (E) H3K79-specific methyltransferases and demethylases on Httex1p-Q93-induced reduced viability. Bars show relative eclosion calculated as the following ratio of eclosed progeny: ((Htt-expressing methylation mutants)/(Htt-expressing controls))/((Htt-non-expressing methylation mutants)/(Htt-non-expressing controls)). The graphs on the right show the effects of heterozygous loss of (B) H3K4, (D) H3K36 or (F) H3K79-specific methyltransferases and demethylases on Httex1p-Q93-induced neurodegeneration. Bars show the differences of average number of rhabdomeres per ommatidium in the eyes of methylation mutant Htt expressing flies and Htt expressing control siblings. Error bars represent standard error of mean. Significant differences are marked by *P < 0.05, **P < 0.01, ***P < 0.001.

