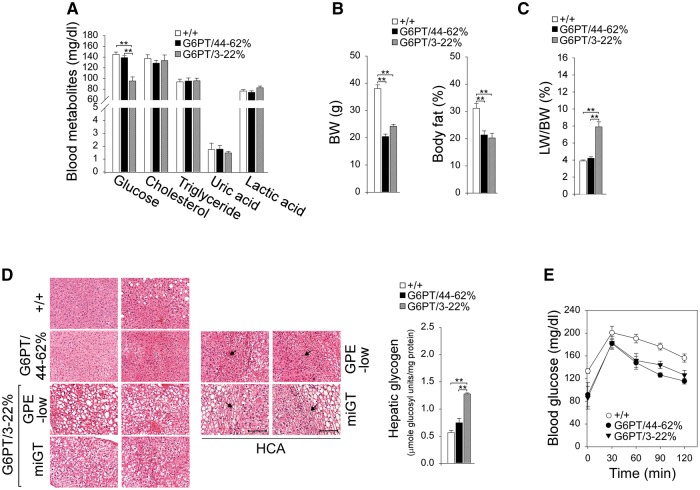
Figure 3.
Phenotype analysis and fasting blood glucose tolerance profiles of 60–78-week-old wild-type and rAAV-treated G6pt−/− mice. The data were analyzed from wide-type (+/+, n = 30), G6PT/44–62% (n = 6), and G6PT/3–22% (GPE-low, n = 9 and miGT, n = 15) mice. (A) Blood glucose, cholesterol, triglyceride, uric acid, and lactic acid levels. (B) BW and body fat values. (C) LW/BW ratios. (D) H&E stained liver sections and hepatic glycogen contents. Each plate represents an individual mouse, so two mice are shown for each treatment. Two representative H&E stained HCA are shown in the GPE-low and the miGT mice. Scale bar = 200 µm. The arrow denotes HCA. (E) Glucose tolerance test profiles. Data represent the mean ± SEM. *P < 0.05, **P < 0.005.

