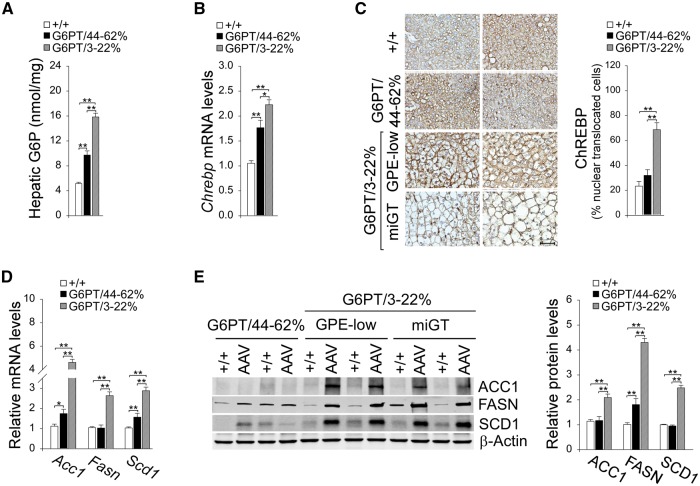
Figure 5.
Analysis of hepatic ChREBP signaling in 60–78-week-old wild-type and rAAV-treated G6pt−/− mice. For quantitative RT-PCR and hepatic G6P levels, the data represent the mean ± SEM for 60–78-week-old wild-type (n = 30), G6PT/44–62% (n = 6), and G6PT/3–22% (GPE-low, n = 9 and miGT, n = 15) mice. (A) Hepatic G6P levels. (B) Quantification of ChREBP mRNA by real-time RT-PCR. (C) Immunohistochemical analysis of hepatic ChREBP nuclear localization and quantification of nuclear ChREBP-translocated cells. Scale bar = 50 µm. The data represent the mean ± SEM for wild-type (+/+, n = 7), G6PT/44–62% (n = 4), and G6PT/3–22% (n = 15) mice. (D) Quantification of mRNA for Acc1, Fasn, and Scd1 by real-time RT-PCR. (E) Western blot analysis of ACC1, FASN, and SCD1, β-actin and quantification of protein levels by densitometry of wild-type (+/+, n = 17), G6PT/44–62% (n = 5), and G6PT/3–22% (n = 12) mice. Data represent the mean ± SEM. *P < 0.05, **P < 0.005.

