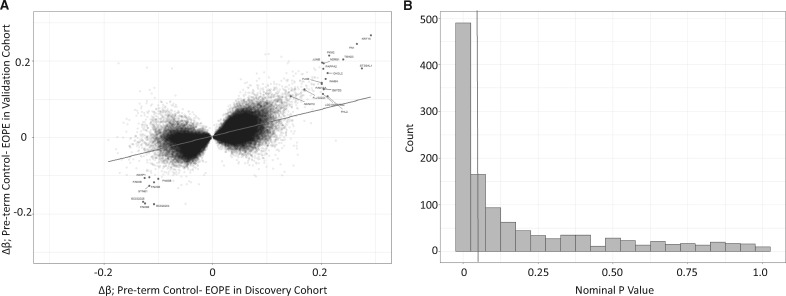
Figure 2.
(A) The correlation between the change in DNAm (Δβ values) between early-onset PE (EOPE) and pre-term controls, between the discovery and validation cohorts. The sites highlighted are the top sites labeled by the gene associated with the CpG site. (B) P-value distribution of the 1703 EOPE hits from the discovery cohort, in the validation cohort.

