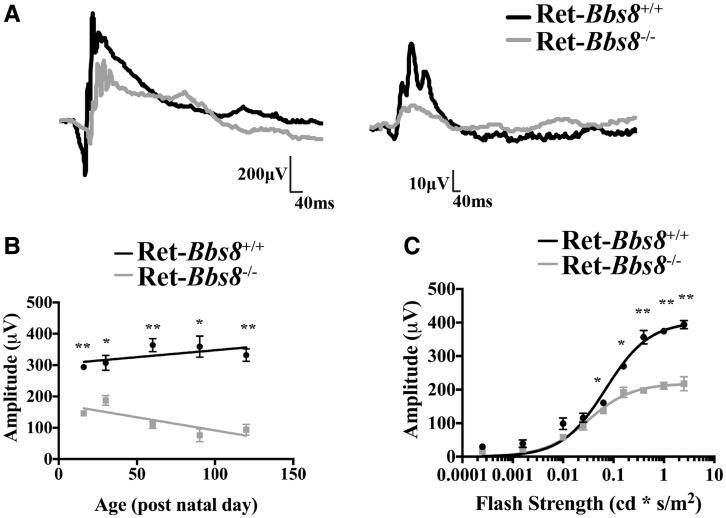
Figure 2.
Reduced photoresponse as measured by electroretinography. (A) Scotopic ERG response from Ret-Bbs8 +/+ (Black) and Ret-Bbs8 −/− (Grey) animals measured at P16 (left panel). Representative trace of a scotopic ERG response measured at -0.8 cd.s−1m2. Photopic ERG response measured under light-adapted conditions at 0.69 log cd.s−1m2 at P16 (right panel). (B) Decline in rod photoreceptor response measured by “a” wave response plotted against the age of the animal at which ERG was recorded. Data are represented as mean ± SEM (n = 6, unpaired two-tailed t-test; *P < 0.05, **P < 0.0009). (C) Stimulus intensity curve of scotopic “a”-wave at P16 of Ret-Bbs8 −/− and littermate controls (n=6). The data were fitted with a hyperbolic function with a half-saturating intensity of 0.07 ± 0.01 cd.s m −2 (Littermate control, n=6) and 0.03 ± 0.01 cd.s m−2 (Ret-Bbs8−/−, n=6), and maximum amplitudes of 403 ± 20 µV (Littermate control, n = 6) and 219 ± 6 µV (Ret-Bbs8−/−, n = 6). Data are represented as mean ± SEM (n=6, unpaired two-tailed t-test; * P ≤ 0.01, **P ≤ 0.0009).

