Figure 4.
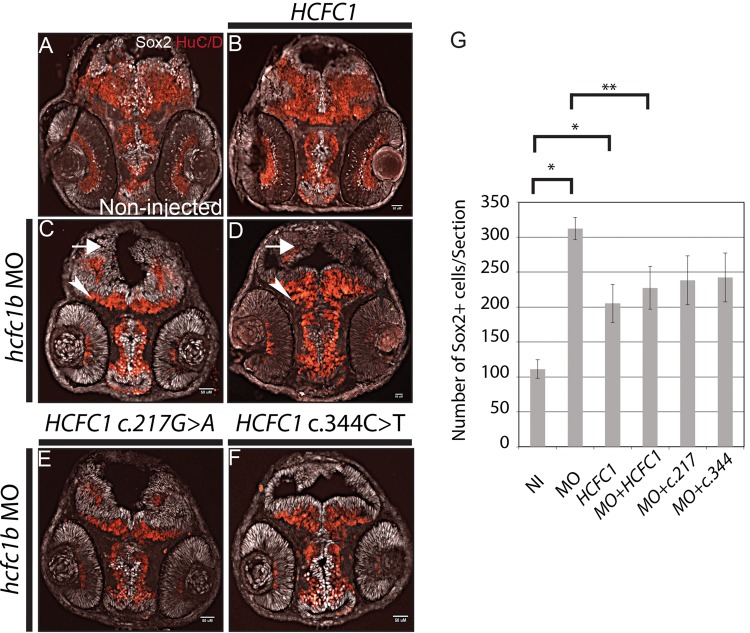
hcfc1b regulates neural stem cell differentiation. (A–F) Sox2 and HuC/D expression analysis using antibody immunohistochemistry in 2 days post fertilization (dpf) zebrafish embryos are shown. (A) non-injected embryos (NI), (B) embryos injected with HCFC1 mRNA, (C) hcfc1b morpholino-injected (hcfc1b Mo), (D) co-injected with hcfc1b Mo and wild-type HCFC1 mRNA, (E) co-injected with hcfc1b Mo and mutated HCFC1 c.217G>A (217), (F) co-injected with hcfc1b MO and mutated HCFC1 c.344C>T (344) mRNA. Arrowheads demonstrate regions of HuC/D expression and arrows indicate Sox2 expression. For A, B, C, and D, n = 12 per group. For E&F, n = 9 per group. G) Bar graph showing the cell counts of Sox2+ cells in sections from A-F. NI= non-injected, MO = hcfc1b morpholino injected, HCFC1 = wild type HCFC1 mRNA injected, MO + HCFC1 = co-injected as in (D), MO + c.217 = co-injected as in (E), MO + c.344 = co-injected as in (F). The counts were carried out in 9 sections in each category (n = 9) and error bars are shown. Asterisks denote results that were statistically significant. Cells were counted in 12 sections each of A–D, and 9 sections each of E–F. Error bars are shown * denotes significance relative non-injected control embryos and ** denotes significance relative to hcfc1b morphant embryos.

