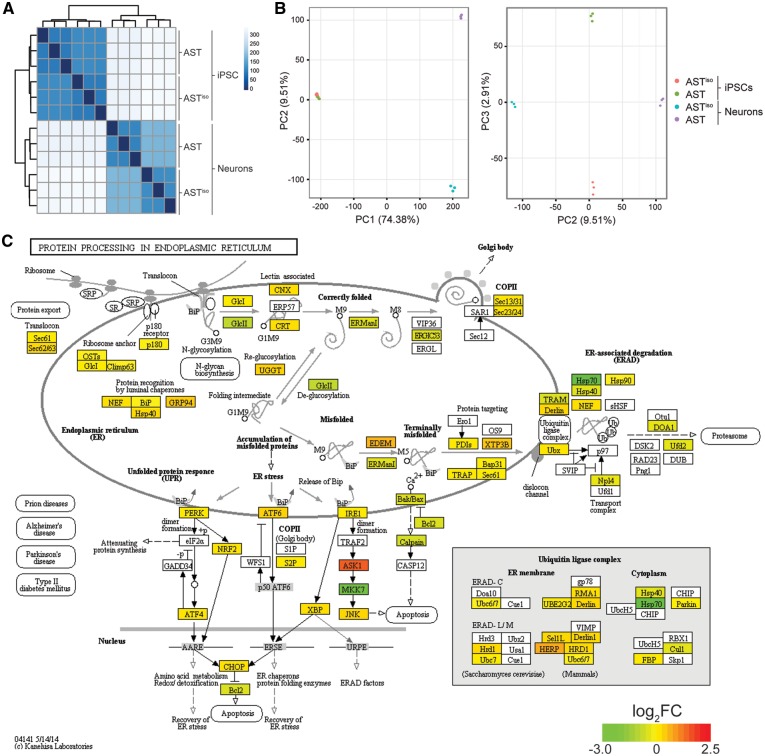
Figure 2.
Comparative transcriptomic analysis reveals an ER stress phenotype specific to SNCA triplication iPSC-derived neurons. (A) Cross-correlation and clustering analysis between datasets. Color denotes correlation coefficient. The primary source of variation is between iPSCs and iPSC-derived neurons, followed by AST and ASTiso genotypes in neurons. (B) Principal component analysis of differentially expressed genes. The first principal component (PC1) accounts for 74.38% of the variance, largely due to differentiation stage. PC2 accounts for the differences in AST and ASTiso genotypes in neurons (9.51% variance) and PC3 similarly accounts for genotype differences in iPSCs (2.91% variance). Cell types are indicated as follows: red = ASTiso iPSC, green = AST iPSC, blue = ASTiso neurons and purple = AST neurons. (C) Protein processing in the endoplasmic reticulum KEGG pathway diagram highlighting fold changes in gene expression between AST and ASTiso iPSC-derived neurons. Color indicates log2 gene expression change (red is higher in AST neurons). Data show biological triplicates, **Q < 0.01, ***Q < 0.01, ns = not significant. See also Supplementary Material, Figs S3–S5, Tables S1 and S2.

