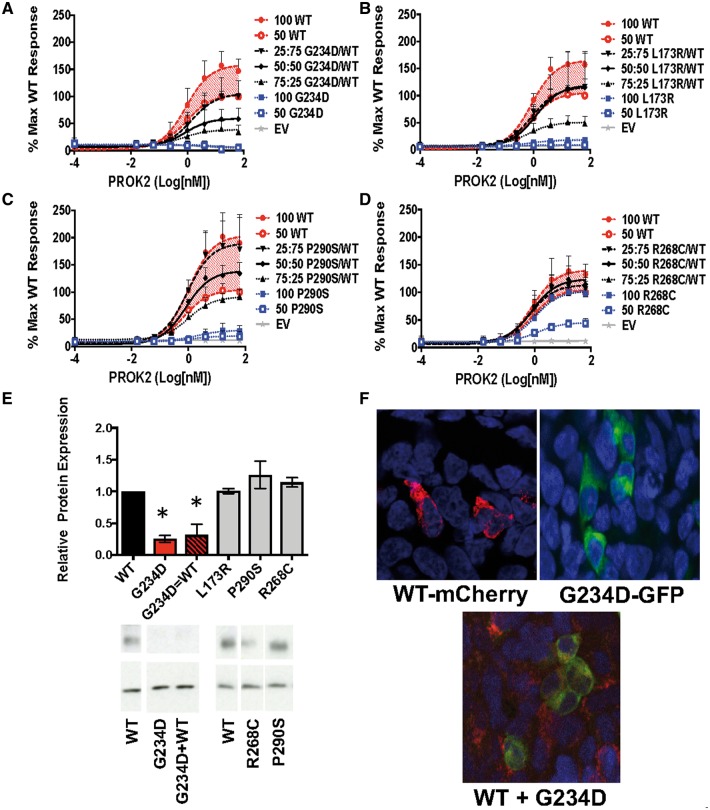
Figure 3.
Dose Response Curves of MAPK Signaling for Mutants Co-transfected with Varying Doses of WT PROKR2. (A–D) Representative data from the MAPK signaling assay are shown as log-dose-response curves from three separate experiments run in triplicate (± SEM) calculated relative to the maximum WT response. (A) Signature #1: When co-transfected with WT, the G234D variant had a dominant negative effect on WT signaling as shown by reduced signaling at an equal (50: 50, G234D/WT) ratio, and a further reduction with increased mutant (75: 25, G234D/WT), both < 50 WT < 100 WT (P < 0.05). (B) Signature #2: Co-transfection of L173R with WT revealed the mutant was unable to contribute to MAPK signaling, but did not impact WT signaling (50: 50 L173R/WT different from 100 WT; P < 0.05). (C) Signature #3: Co-transfection of P290S with WT seemed to partially rescue P290S signaling (50 WT < 50: 50 P290S/WT < 100 WT; P < 0.05). (D) Signature #4: When co-transfected with WT, MAPK signaling by the R268C mutation was completely rescued (50: 50 R268C/WT = 100 WT). (E) Western blots were probed with antibodies to V5 (tagging PROKR2) and β-Actin. Graphed data are presented as mean (± SEM) from 3 separate experiments. For representative blots, some lanes from gels have been removed and reordered, but all lanes from the same blot are shown together with the WT they were compared with and were unaltered. Relative protein expression and representative blots of mutants alone and mutants + WT as compared with WT alone. Red bars: mutant G234D showed potential dominant negative interactions in the MAPK signaling pathway and reduced protein expression as compared with WT, *P < 0.05. (F) Confocal images of WT-mCherry-PROKR2, mutant G234D GFP-tagged PROKR2, and co-transfection of WT and mutant. In contrast to other mutants rescued by WT, the G234D mutation appeared to sequester WT-PROKR2 intracellularly (yellow labeling).

