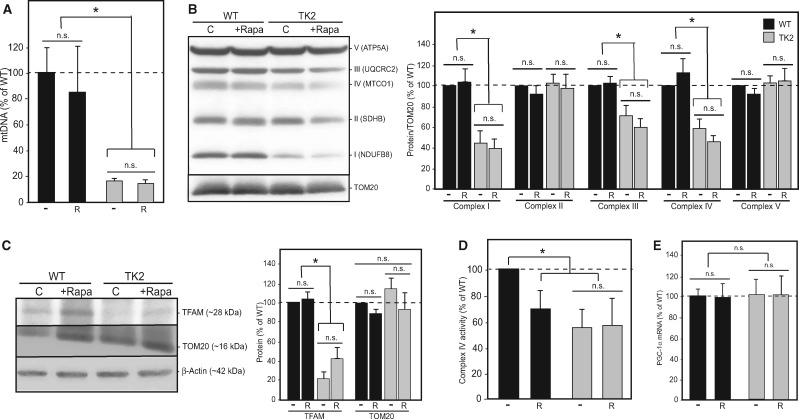
Figure 4.
Rapamycin does not affect mtDNA disease in the brains of treated TK2 mice. (A) Quantitation of brain mtDNA levels [relative to nuclear DNA (Gapdh)] by qPCR in 15- to 18-day-old pups (n = 11, n = 12, n = 10, and n = 13 for untreated WT, rapamycin-treated WT, untreated TK2, and rapamycin-treated TK2 mice, respectively). (B) Representative western blot and quantitation (n = 6) of representative subunits from respiratory complexes I–V, normalized to TOM20. (C) Representative western blot and quantitation (n = 6) for TFAM, TOM20 and β-actin; TFAM was quantitated relative to TOM20, and TOM20 relative to β-actin (n = 6). (D) Complex IV activity was measured in isolated mitochondria from brain tissue using a Seahorse XFe24 flux analyzer and the standard electron flow assay; values were normalized to total mitochondrial content (n = 5). (E) Quantitation of PGC-1α signal by qRT-PCR (n = 5). For all graphs, values are shown as percentages relative to untreated WT, with error bars indicating standard deviation, and significance tested by Welch’s t-test at 95% confidence. Other notation as in Figure 3.

