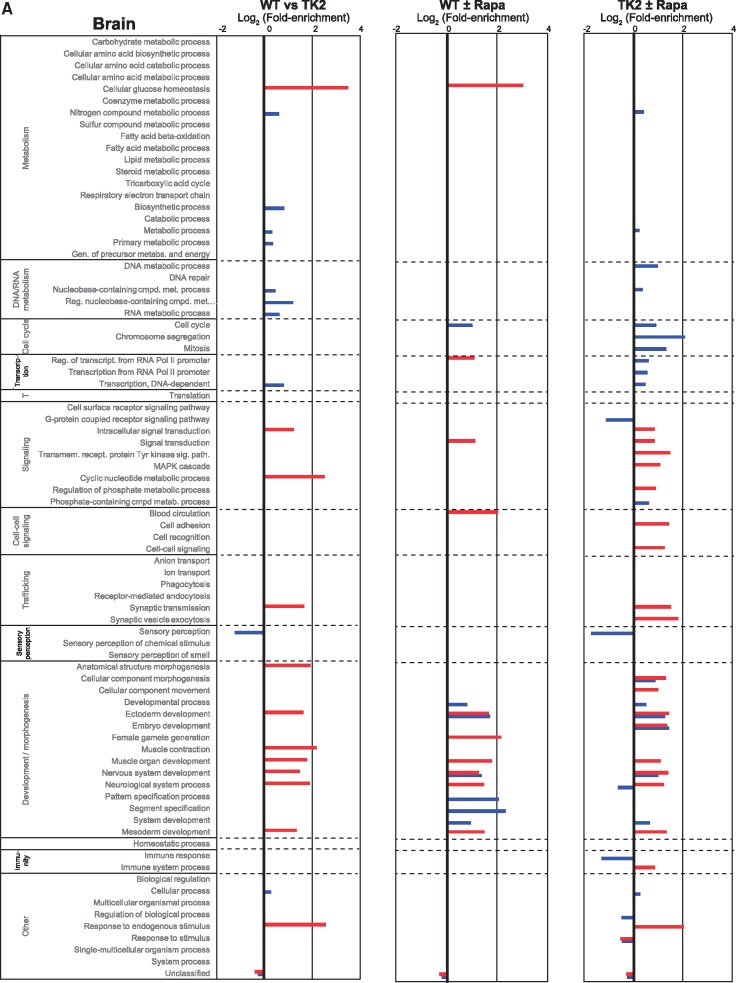
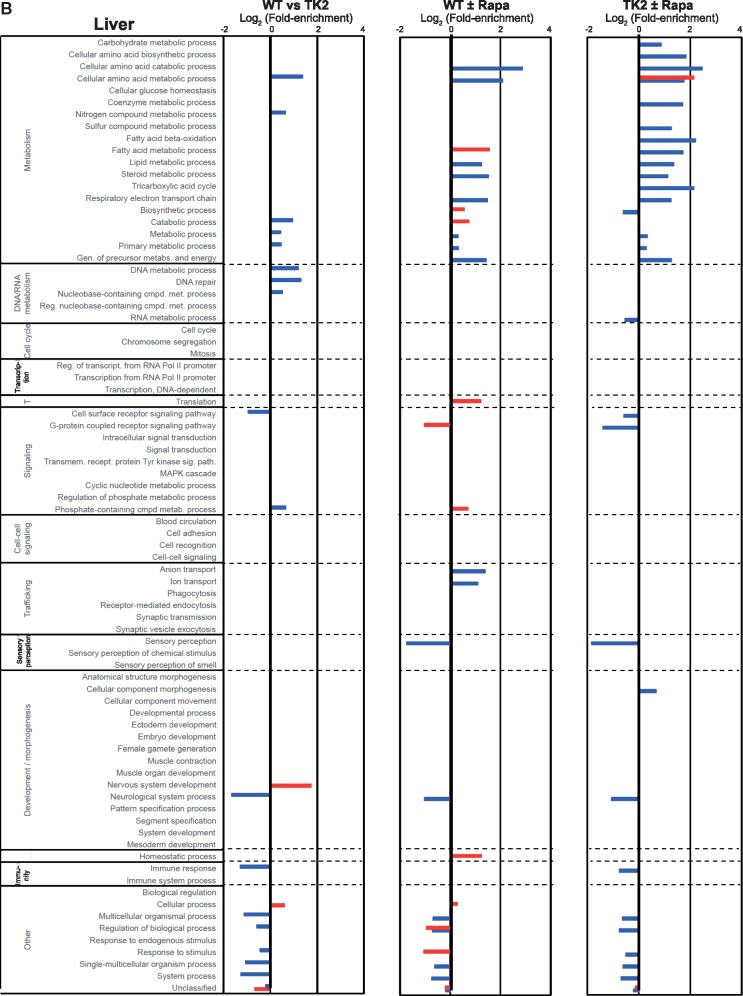
Figure 6.
RNA-Seq analysis. Overrepresentation analysis based on the PANTHER GO-Slim biological process gene ontology categorization of differentially expressed genes identified by the DESeq2 (blue bars) and edgeR (red bars) algorithms for the indicated comparisons (3 biological replicates for each condition). Bars denote log2 fold-enrichment of the indicated GO category, representing relative likelihood that the process is (positive values) or is not (negative values) an important source of the difference between groups. (A) Brain, (B) Liver.


