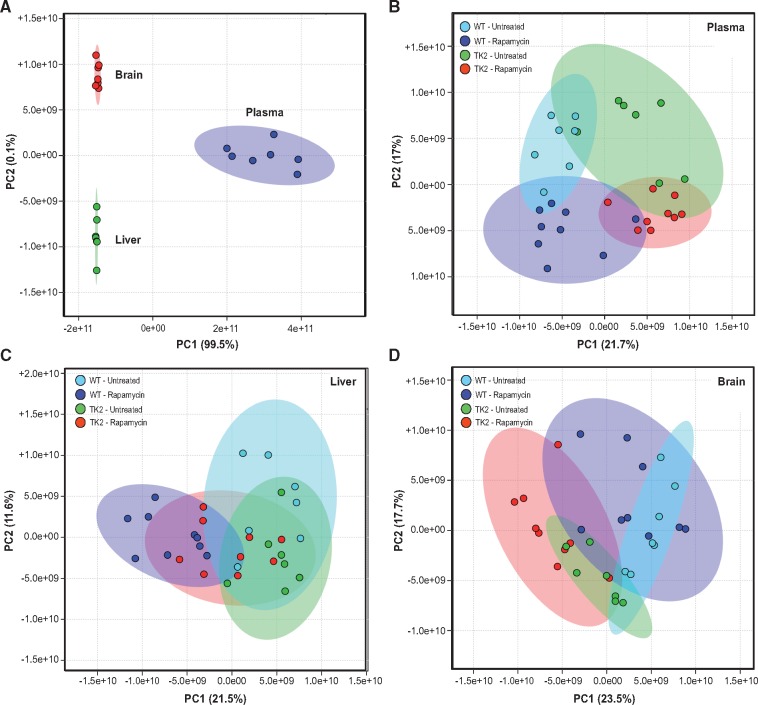
Figure 7.
Unsupervised analysis of metabolomics data by principle component analysis. PCA was performed on all 32 mice in the 4 treatment groups: untreated WT, rapamycin-treated WT, untreated TK2, and rapamycin-treated TK2. (A) Positive control for PCA using ∼55 identified compounds common to the brain, liver and plasma of untreated WT mice (n = 7). (B–D) PCA performed on all 32 mice using the 25–30 most significantly altered compounds in plasma (B), liver (C), and brain (D). Colored ellipses represent 95% confidence range for the indicated biological group.

