Figure 8.
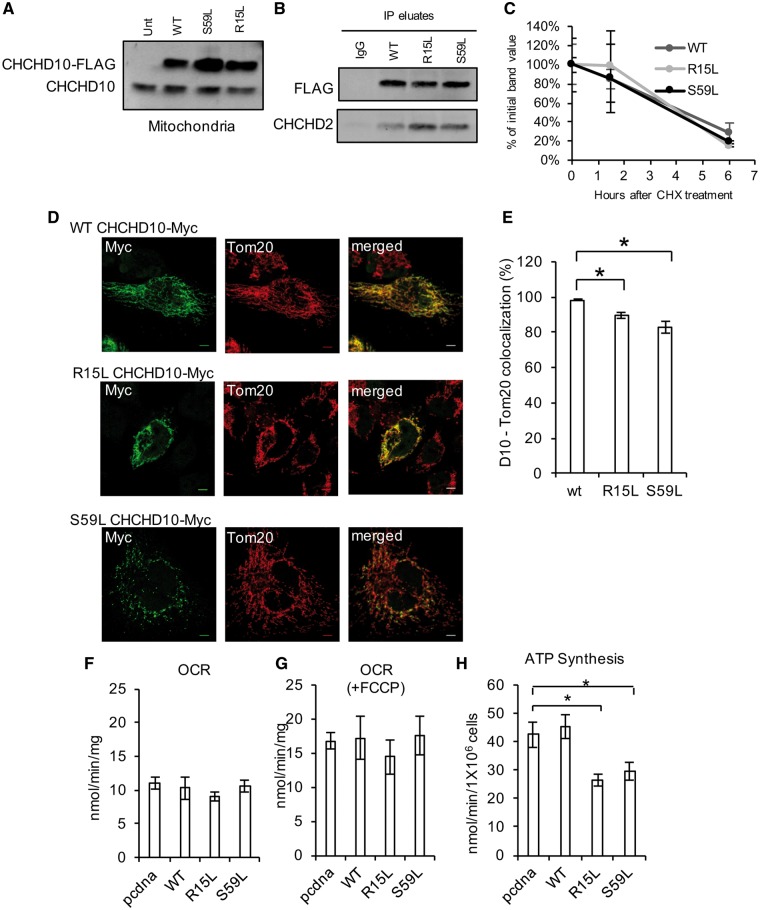
Mutant CHCHD10 overexpression in HEK293 cells. (A) Western blot of crude mitochondrial fractions from control HEK293 cells and cells transfected with WT CHCHD10-FLAG, R15L CHCHD10-FLAG or S59L CHCHD10-FLAG. (B) Co-IP of WT, R15L or S59L CHCHD10-FLAG with FLAG antibody or IgG control. Immunoblot: FLAG, CHCHD2. (C) Quantification of Western blot band intensity following CHX treatment. Data are expressed as percentage of the FLAG intensity at 0 h. n = 4. (D) Representative images of HeLa cells transfected with WT CHCHD10-Myc, R15L CHCHD10-Myc or S59L CHCHD10-Myc and immunostained for Myc (green) or Tom20 (red). Bar = 5 μm. (E) CHCHD10 and Tom20 percentage of colocalization n = 15 cells for WT CHCHD10-Myc, n = 22 cells for R15L CHCHD10-Myc, n = 25 cells for S59L CHCHD10-Myc. (F–G) Oxygen consumption rate (OCR) in cells transfected with empty vector (pcdna) or CHCHD10-FLAG, before or after FCCP treatment (1 μM). n = 3. (H) ATP synthesis in cells transfected with empty vector (pcdna) or CHCHD10-FLAG. n = 3 to 5.

