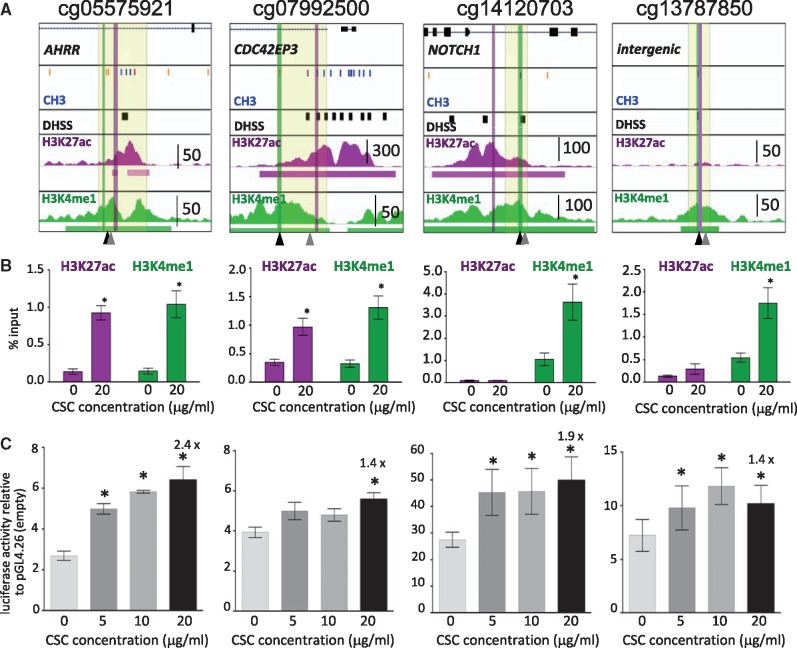
Figure 2.
CSC-induced changes in enhancer marks in A459 cells. (A) Each diagram displays RefSeq genes at top (if present; hg19 coordinates) and from top to bottom, ENCODE data in A549 cells: Illumina Infinium HumanMethylation450 BeadChip CpG methylation status (blue = unmethylated; orange/purple = partially methylated; the CpGs of interest are marked by black arrowheads at bottom); DNase hypersensitive sites (DHSS) as black boxes; H3K27ac and H3K4me1 profiles with called peaks underlined and peak height scale indicated. Locations of PCR primers used for ChIP assays of H3K27ac and H3K4me1 panel B are indicated by purple and green vertical lines respectively. The region highlighted in pale yellow was cloned into a basal promoter-containing luciferase gene reporter vector (pGL4.26, panel C). The positions of AHR binding sites are indicated by gray arrowheads at the bottom. (B) ChIP assays of H3K27ac and H3K4me1 in vehicle- or CSC-treated A549 cells expressed as % input. * indicates luciferase activity statistically significantly different from vehicle (P < 0.05 paired Student's t test). Bars represent mean ± SEM of samples assayed in three or more independent trials of A549 cells exposed to CSC for 48 h. (C) Luciferase reporter assays to test for CSC-regulated enhancer activity. The region highlighted in pale yellow in panel A was cloned into the basal promoter-containing luciferase vector pLG4.26. In each case we ensured that the DNase hypersensitive site closest to the hypomethylated CpG was included. The plasmids were transfected into A549 cells that were treated with vehicle or CSC at the indicated doses 24 h after transfection. A renilla expression plasmid was cotransfected for DNA quantity normalization. Luciferase activity was measured at 24 h after CSC exposure, and is indicated relative to empty vector. All expression levels were statistically significantly elevated relative to pGL4.26. Significant induction relative to vehicle is indicated by an asterisk and the fold induction is noted for 20 µg/ml CSC. Bars represent mean ± SEM of three or more independent experiments.

