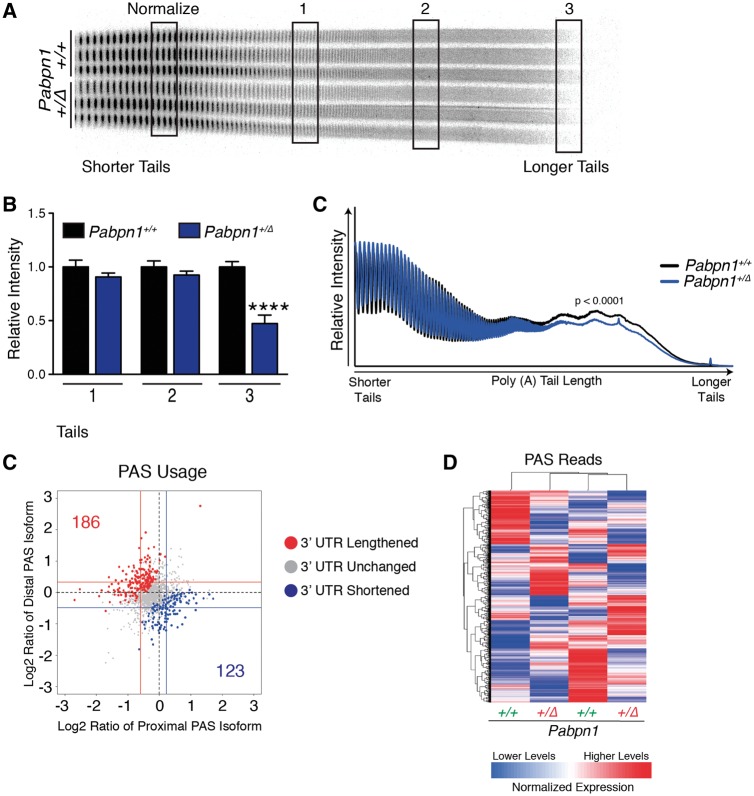
Figure 7.
Decreased poly(A) tail length but no change in PAS usage in Pabpn1+/Δ mice. (A) Poly(A) tail length was analyzed by polyacrylamide gel electrophoresis of 3’ end labeled poly(A) tracts from total RNA isolated from rectus femoris muscles of three-month-old male Pabpn1+/+ and Pabpn1+/Δ mice. n = 3 per genotype. (B) Quantification of regions representing short (1), medium (2), and long (3) poly(A) tails noted in (A) normalized to the total short poly(A) tails marked in (A) (Normalize) revealed fewer long poly(A) tails in Pabpn1+/A17mice. (C) Quantification of gel from (A) by plotting density along each lane revealed shorter poly(A) tails in Pabpn1+/Δmice. ****P < 0.0001 (D) Scatter plot depicting few changes were detected in poly(A) sequence (PAS) selection as detected by 3'READS. Data are log2 ratio of distal to proximal PAS usage with increased distal PAS represented in red and increased proximal PAS represented in blue. (E) Sample clustering based on PAS usage as detected by 3'READS showing that Pabpn1+/+ and Pabpn1+/Δ mice do not group by genotype. n = 2 mice per genotype.

