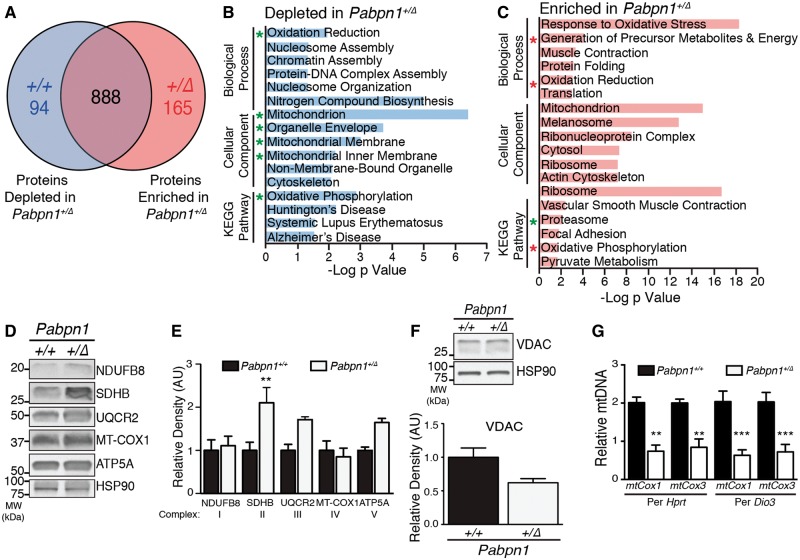
Figure 8.
Mitochondrial defects detected in Pabpn1+/Δ mice. (A) Diagram depicting number of total proteins detected in rectus femoris muscles from three-month-old male Pabpn1+/+ and Pabpn1+/Δ mice and those enriched or depleted in Pabpn1+/Δ mice. (B) Histogram of the log P value of top GO terms and KEGG pathways for proteins depleted from Pabpn1+/Δ mice revealing decreased levels of mitochondrial proteins. Groups that are also depleted in Pabpn1+/A17 mice are marked with a green asterisk. (C) Histogram of the log p value of top GO terms and KEGG pathways for proteins enriched in Pabpn1+/Δmice revealing increased levels of mitochondrial and proteasome proteins. Groups that are depleted rather than enriched in Pabpn1+/A17 mice are marked with a red asterisk. (D) Increased levels of electron transport chain proteins (SDHB, UQCR2, ATP5A) as detected by immunoblot (left) and quantified relative to total HSP-90 (E) in Pabpn1+/Δmice. (F) No change in total mitochondrial content as detected by immunoblot for VDAC (top) and quantified relative to HSP-90 (bottom) in Pabpn1+/+ and Pabpn1+/Δmice. (G) Decreased mitochondrial DNA (mtDNA) as detected by quantitative PCR of mtDNA markers mtCox1 and mtCox3 relative to nuclear genome markers Hprt and Dio3 in total genomic DNA fromPabpn1+/+ and Pabpn1+/Δmice. All quantitative data are mean ± SEM from n = 3 animals per genotype. *P < 0.05.

