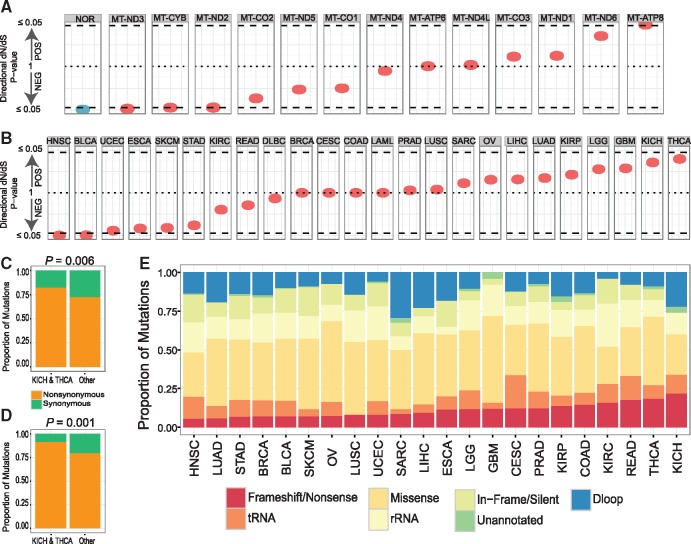
Figure 2.
Tissue-specific signals of selection on tumor mitochondrial genomes. (A) Nominal P-values derived from dN/dS permutation analysis to indicate direction and statistical significance of selection on protein-altering variants in normal (NOR, blue), and tumor cells (red) across mitochondrial genes and (B) across individual cancer types. (C) Proportions of synonymous and nonsynonymous mtDNA mutations including both tumor-specific somatic variants and those already present in the normal cell and (D) tumor-specific somatic variants only. (E) Proportions of mtDNA variants of various categories, stratified by tumor type.

