Fig. 5.

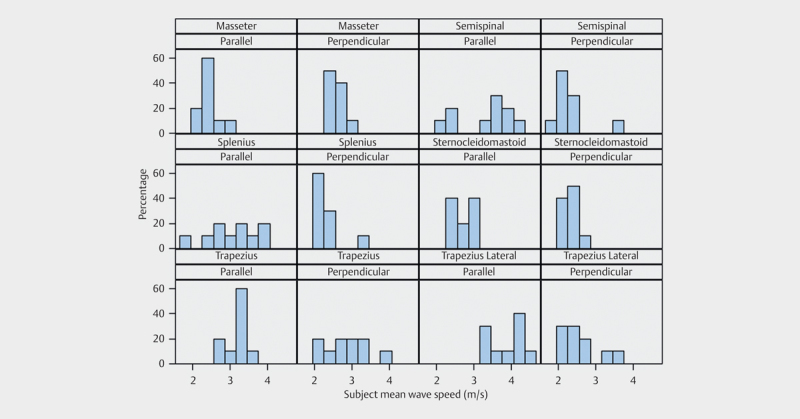
Probability histogram panel plot. X-axis shows mean shear wave speed and y-axis shows proportion of subjects for all examined muscles in two planes.

Probability histogram panel plot. X-axis shows mean shear wave speed and y-axis shows proportion of subjects for all examined muscles in two planes.