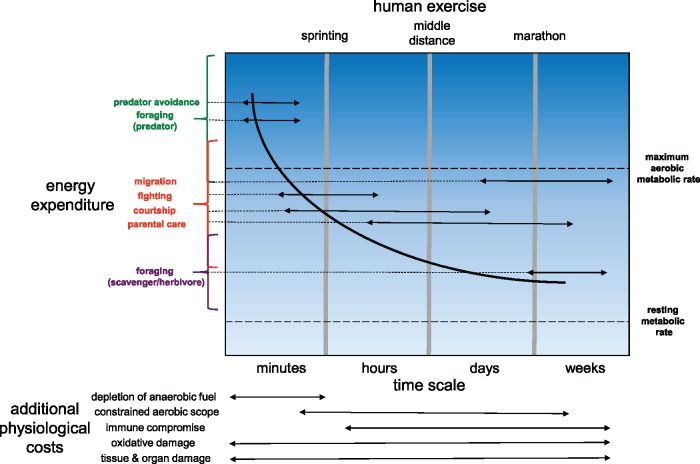
Fig. 1.
The potential costs of various behaviors associated with high levels of physical activity, inspired by Piersma (2011) and Peterson et al. (1990). The dark curve represents the sustainable level of energy throughput to support activity over a given time frame. At shorter temporal scales, increased energy can be spent on activity without incurring additional physiological costs. Activities that use amounts of energy above this line will potentially incur additional physiological costs (as indicated at the bottom of the figure) with potential implications for individual fitness. Individuals may minimise costs by either: (1) reducing the energetic costs of each behavior, by decreasing the frequency of each behavior or increase the efficiency with which it is performed; (2) adjusting physiological traits to attenuate the negative effects of operating above a sustainable level for various amounts of time (e.g., through training-induced plasticity). The width of the arrow associated with each type of behavior approximates the time scale over which each can occur; the elevation along the y-axis (in combination with the brackets along the y-axis) approximates the energy required for each behavior. Similarly, the width of the arrow associated with each physiological cost roughly indicates the temporal scale and activity types most likely to elicit each effect. At the top of the figure, types of human exercise (associated with running, specifically) are indicated that may be viewed as analogous to the non-human animal behaviors that elicit various intensities of activity at various temporal scales. Note that human exercise labels do not strictly align with the temporal labels along the x-axes.

