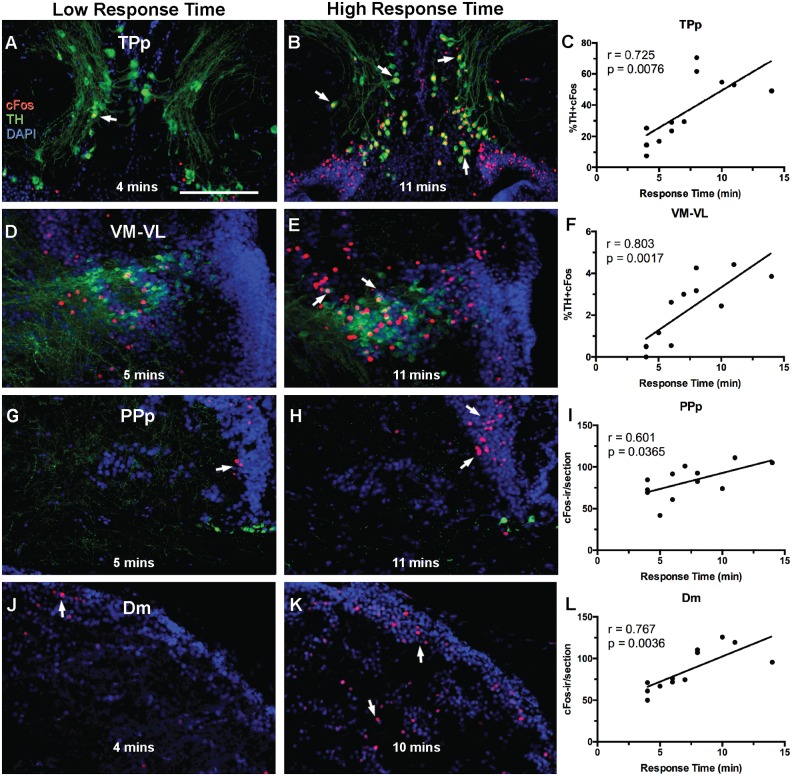
Fig. 1.
Example micrographs showing nuclei found to have a significant relationship between time attending speaker and TH-ir + cFos colocalization (A–F) or cFos expression (G–L) in transverse sections. Graphed representation of data (n = 12) and Pearson’s correlation results are presented for each region (C,F,I,L). Arrows in A–E indicate cFos-ir colocalized to TH-ir nuclei. (A–C) Periventicular posterior tuberculum (TPp): mean % colocalization of cFos in TH-ir cells is 36.28% ± 5.94%. (D–E) Ventromedial and ventrolateral nuclei of the thalamus (VM-VL): mean % colocalization of cFos in TH-ir cells in VM-VL is 2.2% ± 1.6%. (G–I) Posterior parvocellular preoptic nucleus (PPp) mean number of cFos cells per section is 82.21± 19.8. (J–L) Medial zone of the dorsal telencephalon (Dm): number of cFos cells per section in Dm is 85.8 ± 24.8. Arrows in G–K indicate Fos-ir within areas of interest. Scale bar = 100 µm.

