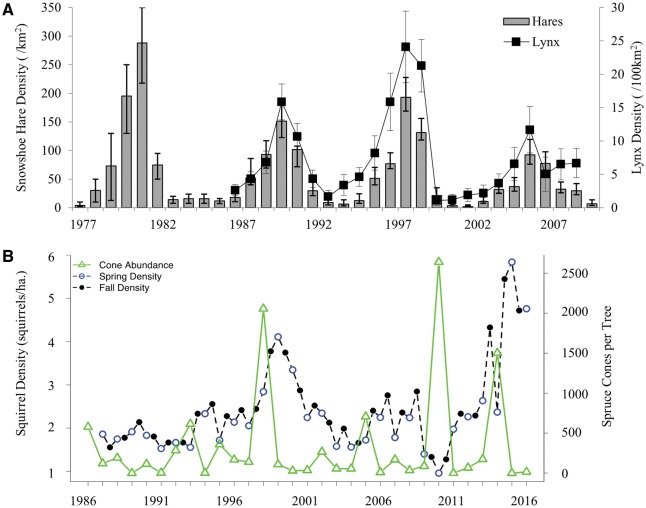
Fig. 2.
Density changes over time (year) in (A) the 10-year population cycle of snowshoe hares and lynx (±95% CI; adapted from Krebs et al. 2014) and (B) the mast-density relationship between red squirrels and white spruce (adapted from Dantzer et al. 2012).

