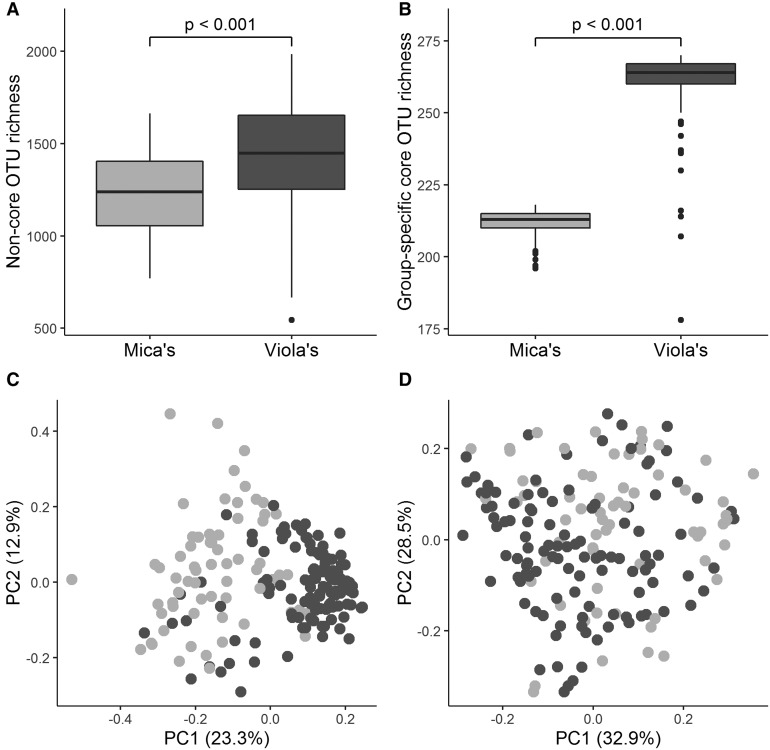
Fig. 2.
Boxplots showing differences in gut microbial OTU richness for (A) non-core and (B) the group-specific core gut microbial communities in each social group. Plots C and D show principal coordinates analyses of weighted UniFrac dissimilarities for (C) non-core and (D) core gut microbial communities. Mica’s group is shown in light gray and Viola’s group is shown in dark gray for each panel.

