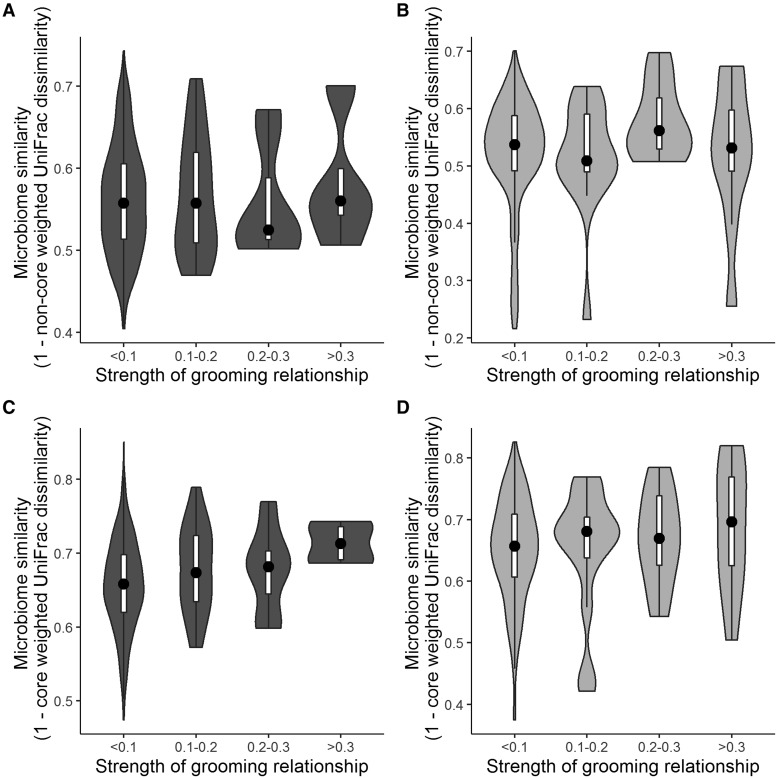
Fig. 3.
Violin plots showing the relationship between the strength of grooming relationships and the gut microbial communities. Black dots represent median values and white rectangles represent the first and third quartiles of the data. Rotated kernel density plots representing the underlying data are shown on each side. Stronger bonds predict more similar gut microbiotas in (C) the core microbiome in Viola’s group but not in (A) the non-core microbiome in Viola’s group, (B) the non-core microbiome in Mica’s group, or (D) the core microbiome in Mica’s group.

