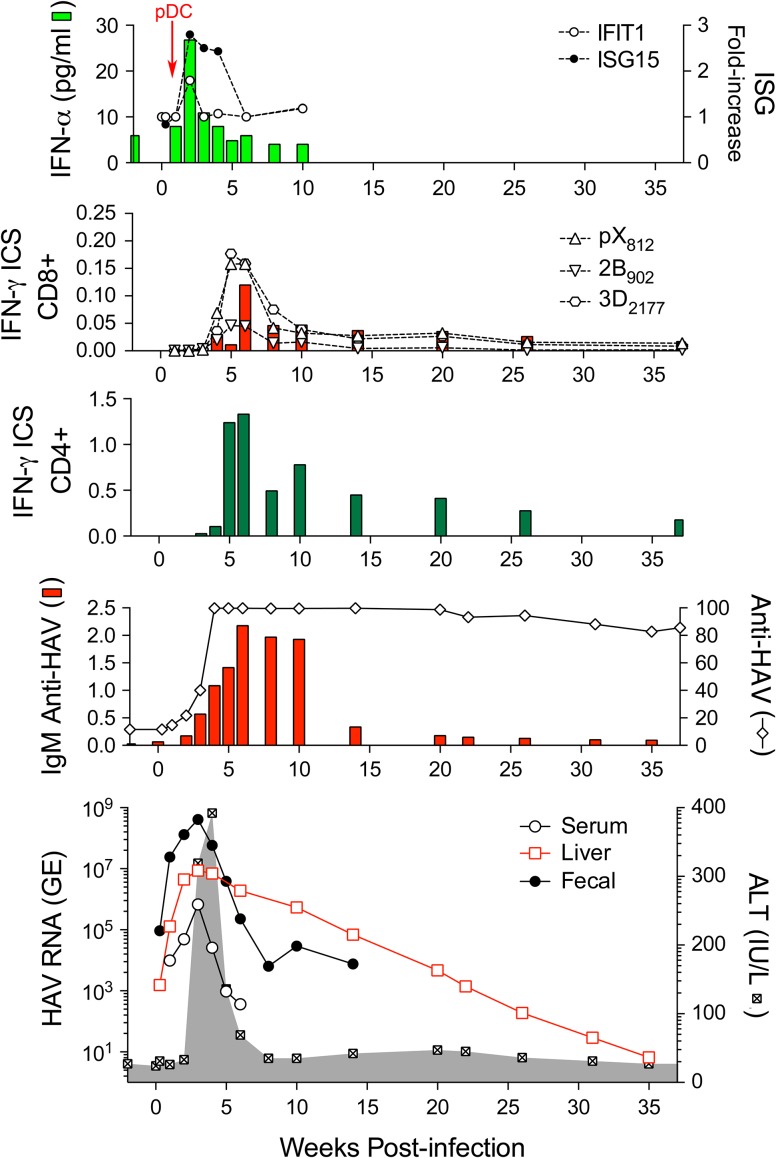
Figure 4.
Virologic and immunologic events during acute HAV infection in a chimpanzee inoculated intravenously with wild-type HAV. The bottom panel shows the presence of viral RNA (GE, genome equivalents) in serum (GE/ml), feces (GE/gm), and liver tissue (GE/μg total RNA) in relationship to serum alanine aminotransferase (ALT) activity shown in the shaded zone. The prolonged persistence of intrahepatic HAV RNA is surprising. The panel immediately above shows total anti-HAV antibody (% blocking in a competitive ELISA assay) and IgM anti-HAV (ELISA O.D.) The next two panels show frequencies of HAV-specific CD4+ and CD8+ T cells among peripheral blood mononuclear cells, as determined in an IFN-γ intracellular staining (ICS) assay. CD8+ cells were also quantified on the basis of staining with tetramers targeting epitopes in pX, 2B, and 3Dpol. Note the difference in scale between CD4+ and CD8+ T cell frequencies. The top panel shows type I IFN responses to HAV infection as reflected in minimal and only early serum IFN-α levels detectable by cytokine ELISA, and minimal increases in intrahepatic expression of IFN-stimulated genes IFIT1 and ISG15. pDCs were detected in liver tissue only at 1 week after viral challenge (arrow). Figure reproduced from Curr Opin Virol 2015 Apr; 11:7–13.

