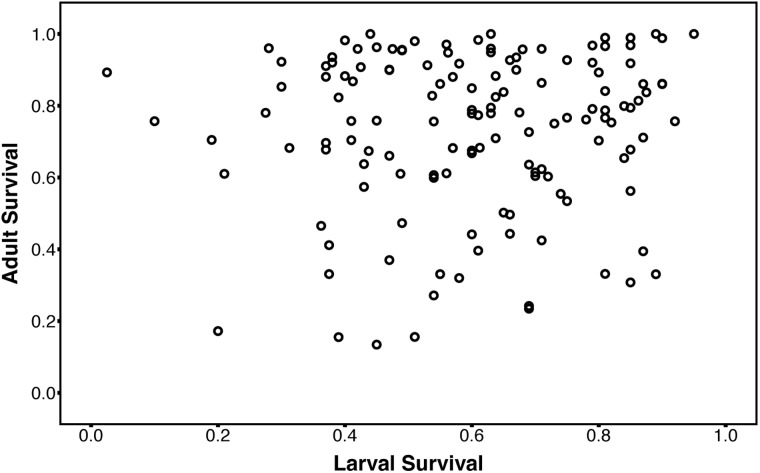
Fig. 1.
Scatterplot of average larval survival (proportion surviving) versus average adult survival after a 1 h exposure to − 5 °C. Each circle represents 1 of the 139 DGRP lines. Both the phenotypic (r2 = 0.00525, P = 0.3966) and genetic correlation (rg = 0.085, P = 0.12) are not significantly different from zero.

