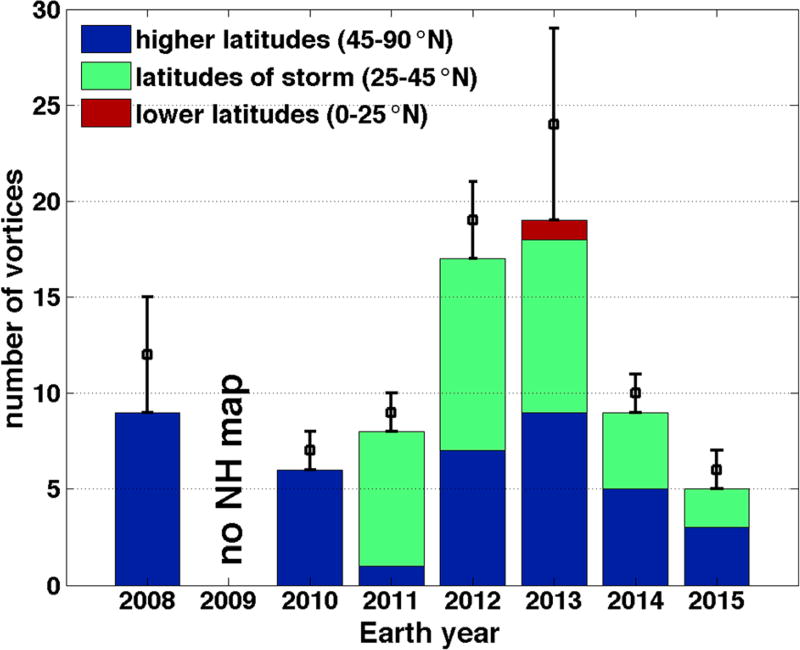
Figure 11.
Numbers of the NH vortices (>1000 km) during the period of 2008–2015. Maps of the recorded vortices are shown in Figures 4–10. The numbers of recorded vortices represent the lower limits of the numbers, and the error bars are estimated based on observational gaps as discussed in the text.

