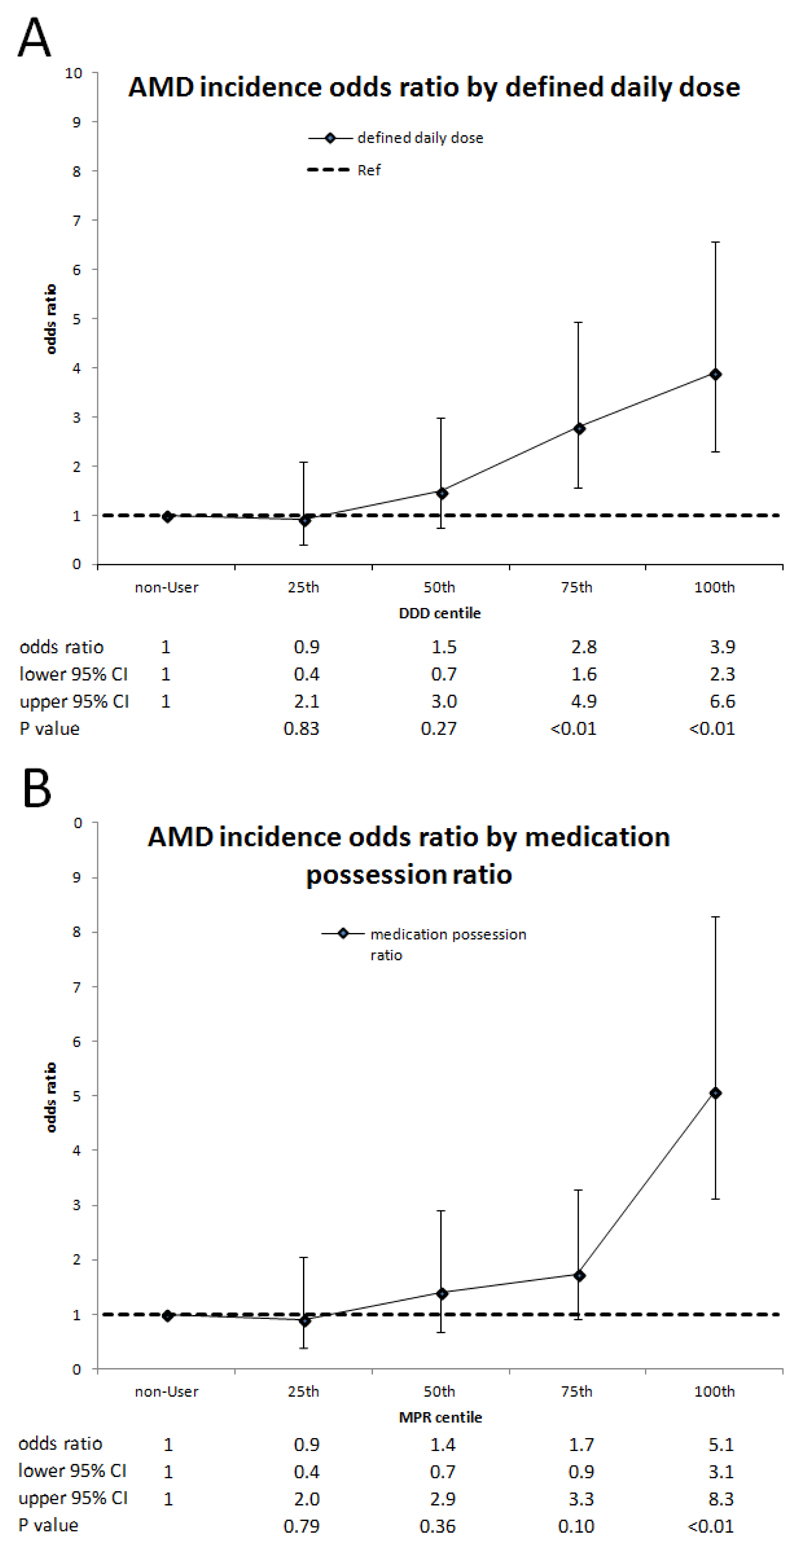
Fig. 3.
Age-related macular degeneration incidence according to (A) bisphosphonate defined daily dose (DDD) and (B) medication possession ratio (MPR)*.
* Odds ratios for AMD incidence (black marker) were obtained from conditional logistic regression. They are presented with their 95% confidence intervals (CI) (error bars) and their P values. Odds ratios are presented for bisphosphonate (BP) use according to quartile of DDD and MPR compared to non-BP use. Markers or error bars lying into the dotted horizontal line denoted statistically non-significant association.

